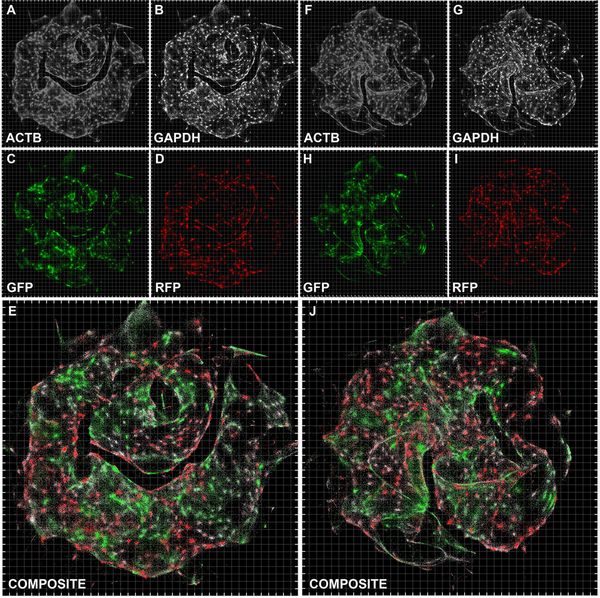
Figure 5. Inferred large scale DNA microscopy images preserve cellular resolution.
Inference using the sMLE global inference approach for sample 1 (A–E) and sample 2 (F–J), with each transcript type shown separately (A–D, F–I) or together (E and J) (although inferences are performed on all transcripts simultaneously and are blinded to transcript identity). Grid-line spacings: diffusion length scales (Ldiff), emerging directly from the optimization (STAR Methods).

