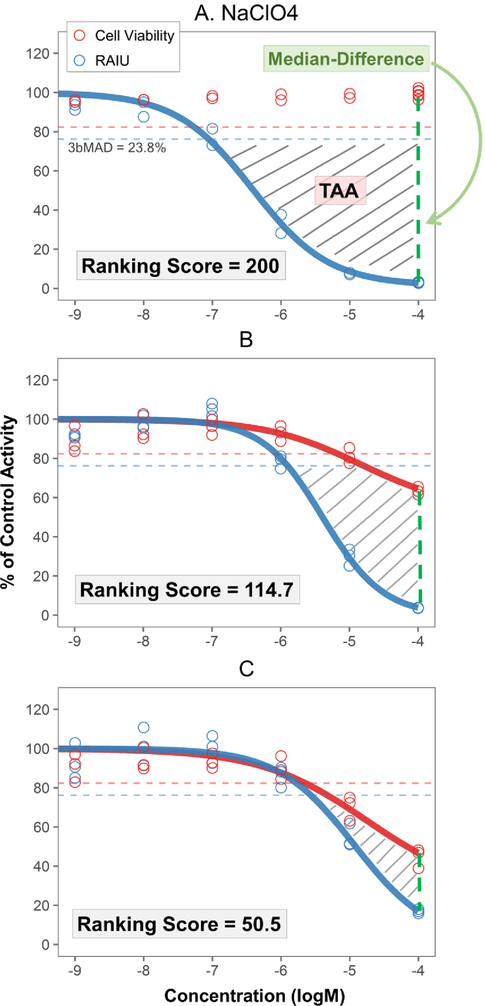
Figure 1. Demonstration of ranking score, TAA and Median-Difference.
Examples of chemical responses: A) sodium perchlorate, B) triphenyltin hydroxide, C) folpet. Cell viability and RAIU assay results are illustrated in red and blue respectively. The red and blue horizontal dotted lines represent the 3bMAD threshold for cell viability and RAIU assay respectively. Toxicity-adjusted area (TAA) is the gray striped area defined by 1) maximum concentration vertical line (right border), 2) the 3bMAD significant threshold horizontal line for RAIU assay (top border; blue dashed line), 3) the dose-response curve of RAIU and 4) if present, the dose-response curve of cell viability. The difference of median responses of RAIU and cell viability at maximum tested concentration (Median-Difference) is indicated by the green vertical dotted line. Sodium perchlorate (A) was chosen as the reference NIS inhibitor to normalize test chemical TAA and Median-Difference as percentage values. Ranking score is obtained as the sum of normalized TAA and Median-Difference values. Therefore, sodium perchlorate has a ranking score of 200. B and C show three test chemicals with less RAIU inhibition and more cytotoxicity relative to sodium perchlorate. As the TAA and Median-Difference values decrease, their ranking scores also decrease.

