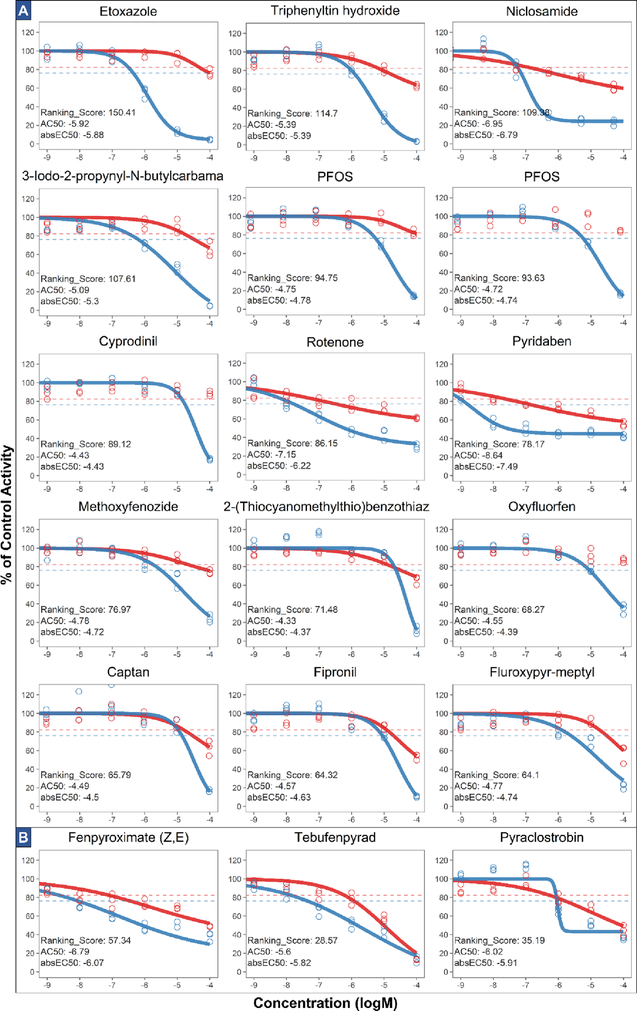
Figure 3. Dose response, ranking score, AC50 and absEC50 of (A) top 15 ranked samples (14 chemicals) and (B) chemicals that disrupt electron transport chain.
Chemical responses (for three bioreplicates) are shown as circles with red representing cell viability assay results and blue representing RAIU assay results. The red and blue horizontal dotted lines represent the 3bMAD threshold for cell viability and RAIU assay, respectively. Dose-response curve was drawn only if significant activity was present. AC50 and absEC50 are expressed as logM.

