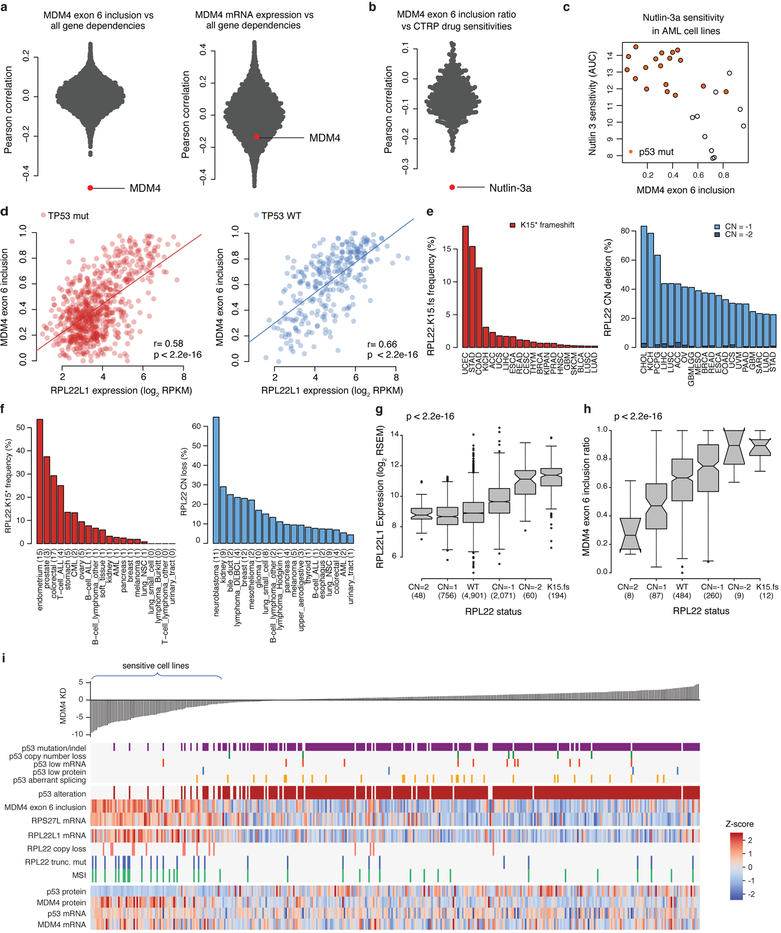
Extended Data Fig. 9. MDM4 alternative splicing and association with RPL22 and RPL22L1.
a, Distribution of MDM4 exon 6 inclusion (left) and MDM4 mRNA expression (right) correlation with all gene dependencies in the Achilles RNAi dataset (n = 189–478; Supplementary Table 10). b, Correlation of MDM4 exon 6 inclusion with sensitivity to all small molecules in the CTRP AUC dataset using all cell lines. Nutlin-3a is the top drug sensitivity correlated with MDM4 exon 6 inclusion (n = 79–810; Supplementary Table 10). c, Example of nutlin-3a sensitivity versus MDM4 exon 6 inclusion in the AML cell lines (Spearman correlation rho = −0.64, P = 3 × 10⁻⁴, n = 28). The y axis shows AUC for nutlin-3a in the CTRP dataset. d, Scatterplot of MDM4 exon 6 inclusion versus RPL22L1 expression for all p53-mutant (left, n = 711) and p53 wild-type (right, n = 288) CCLE cell lines. P values determined by Pearson’s correlation test. e, Frequency of RPL22 recurrent frameshift mutations (left) and copy number deletions (right) in TCGA. f, Frequency of RPL22 recurrent frameshift mutations (left) and copy number deletions (right) in CCLE. g, Correlation of RPL22L1 mRNA expression with RPL22 copy number loss and RPL22 frameshift deletions in TCGA. P value determined by two-sided Kruskal–Wallis rank sum test. Box plots as defined in Fig. 4d. Values in parentheses denote sample size in each category. h, Correlation of MDM4 exon 6 inclusion with RPL22 copy number loss and RPL22 frameshift deletions in TCGA. P value determined by two-sided Kruskal–Wallis rank sum test. Box plots are as defined in Fig. 4d. Values in parentheses denote sample size in each category. i, Selected genomic features that correlate with sensitivity to MDM4 shRNA knockdown. mRNA expression of MDM4 and TP53 are shown for comparison.

