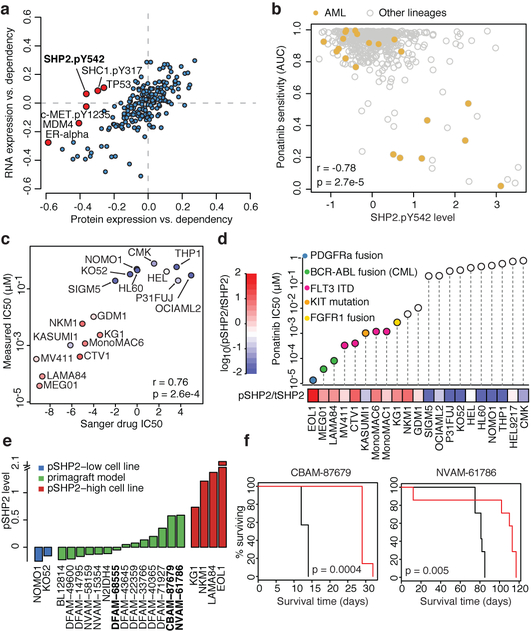
Fig. 5. High pSHP2 is a marker of SHP2 dependence and sensitivity to RTK inhibitors.
a, Global correlations of gene dependency and gene expression (y axis) versus correlation of gene dependency and protein expression. PTPN11 dependency is correlated with pSHP2 expression (Pearson’s r = −0.36, n = 411; P = 4.9 × 10⁻¹⁴) but not with mRNA expression (Pearson’s r = −0.07, n = 478; P = 0.15). b, A subset of AML lines (n = 21) show high pSHP2 expression associated with sensitivity to ponatinib. c, Validation of Sanger GDSC ponatinib sensitivity data in AML (n = 16) and CML (n = 2) cell lines. x axis is sensitivity to ponatinib in the Sanger GDSC dataset; y axis is sensitivity to ponatinib measured by CellTiter-Glo (CTG) cell viability assay. Each dot represents a cell line coloured by pSHP2 over total SHP2 level. IC50, half-maximal inhibitory concentration. d, In vitro validation of association of pSHP2 expression with sensitivity to ponatinib. Cell lines are annotated for known oncogenic events in the RTK pathway. tSHP2, total SHP2. e, pSHP2 levels measured by RPPA in mouse primagraft AML models (n = 14) and control cell lines (n = 6). Three models (bold) were chosen for in vivo validation experiments. f, In vivo mouse xenograft experiment survival curves. Ponatinib treatment prolonged survival in two primagrafts with high pSHP2 levels—CBAM-87679 and NVAM-61786—but not in the low pSHP2 primagraft DFAM-68555 (Extended Data Fig. 11l) (n = 7 mice in each group). P values determined by two-sided Pearson correlation test (a–c) log-rank (Mantle–Cox) test (f).

