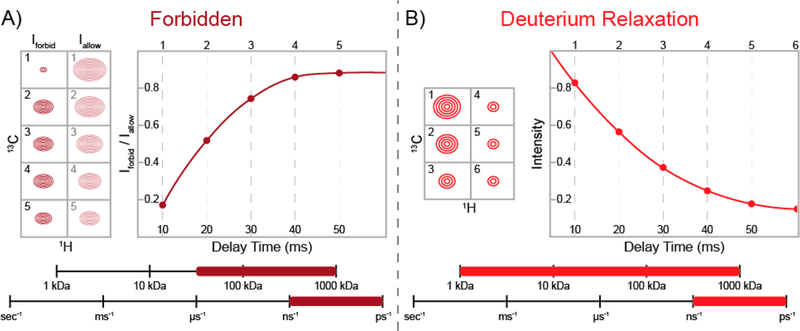
Figure 4.
Schematic representations of NMR experiments used to probe fast (nanosecond-to-picosecond) time scale dynamics in side-chain methyl groups. The ranges of protein molecular weights and time scales where each experiment is sensitive are shown at the bottom of each panel. (A) Schematic of the relaxation-violated methyl 1H “forbidden” experiment.65,79 The raw peak intensities for the “forbidden” (DQ or TQ) coherences (Iforbid) and the allowed (SQ) coherences (Iallow) are shown at five different delay times (left). The ratio of “forbidden” and allowed coherences (Iforbid/Iallow) produces a buildup curve (right), which can be fit to obtain methyl group order parameters reporting on the amplitude of fast-time-scale dynamics. (B) Representative example of deuterium relaxation for a partially deuterated side-chain methyl group (i.e., 13CHD2 or 13CH2D).74 The decreasing peak intensities at different delay times (left) produce a decay curve (right), which reports on fast-time-scale dynamics.

