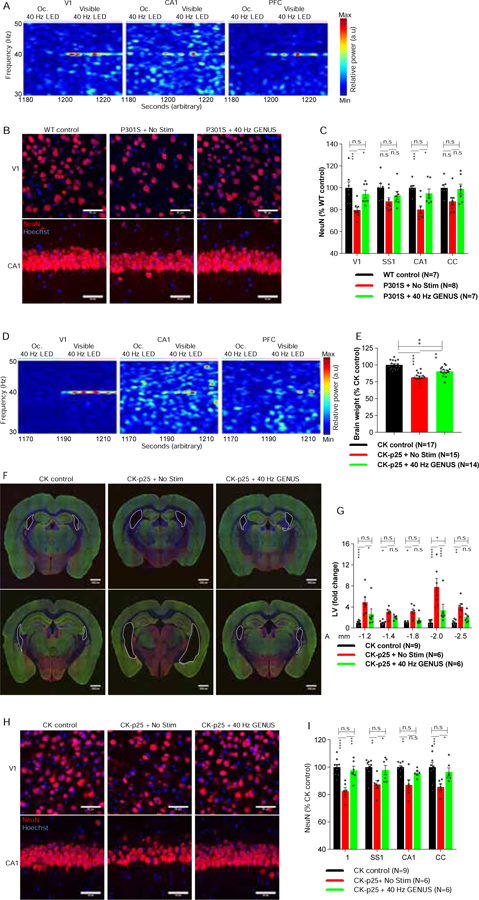
Figure 2. Chronic 40 Hz stimulation reduces neurodegeneration in Tau P301S and CK-p25 mice.

(A) Representative LFP spectra from V1, CA1, and PFC from 8-month-old P301S (see Figure S2A–S2C).
(B) Representative images for NeuN (red) from V1 and CA1 in No Stim or GENUS P301S, with Hoechst labeling of cell nuclei (blue) (Scale bar 50 μm).
(C) Group data quantifying NeuN+ cells (N = 7–8 mice/group. Two-way ANOVA F (2, 76) = 21.8, p < 0.0001. Post-hoc test; WT control Vs No Stim P301S: V1, p = 0.0005; SS1, p = 0.051; CA1, p = 0.0006; CC, p = 0.0500; WT control Vs GENUS P301S: V1, p = 0.844; SS1, p = 0.573; CA1, p > 0.999; CC, p > 0.999; No Stim Vs GENUS P301S: V1, p = 0.016; SS1, p = 0.859; CA1, p = 0.0145; CC, p = 0.090).
(D) Representative LFP spectra from V1, CA1, and PFC from CK-p25 mice after 6 weeks of p25 induction (see Figure S2J–S2L).
(E) Bar graph of brain weight (N = 14–17 mice/groups. ANOVA F (2, 43) = 26.6, p < 0.0001. Post-hoc test; CK control Vs No Stim CK-p25: p < 0.0001; CK control Vs GENUS CK-p25: p = 0.001; No Stim Vs GENUS CK-p25: p = 0.005).
(F) Representative IHC images with vGlut1 (green), GAD65 (red), and Hoechst (blue) of the lateral ventricles (outlined) at anterior-posterior (AP) −1.2 (top row) and −2.0 mm (bottom row) from bregma.
(G) Fold change of size of lateral ventricles (N = 6–9 mice/group. Two-way RM-ANOVA, between groups F (2, 18) = 31.51, p < 0.0001. Post-hoc test; CK control Vs No Stim CK-p25: AP from bregma (mm): −1.2, p < 0.0001; −1.4, p = 0.042; −1.8, p = 0.033; −2.0, p < 0.0001, −2.5, p = 0.002; CK control Vs GENUS CK-p25: −1.2, p = 0.123; −1.4, p = 0.421; −1.8, p = 0.801; −2.0, p = 0.0137; −2.5, p = 0.393; No Stim Vs GENUS CK-p25: −1.2, p = 0.035; − 1.4, p = 0.523; −1.8, p = 0.194; −2.0, p < 0.0001; −2.5, p = 0.085).
(H) Representative images for NeuN (red) in V1 and CA1, and Hoechst labeling of cell nuclei (blue) (Scale bar 50 μm).
(I) Group data quantifying NeuN+ cells (N = 6–9 mice/group. Two-way ANOVA F (2, 72) = 31.38, p < 0.0001. Post-hoc test; CK control Vs No Stim CK-p25: V1, p < 0.0001; SS1, p = 0.001; CA1, p = 0.002; CC, p = 0.0007; CK control Vs GENUS CK-p25: V1, p > 0.99; SS1, p > 0.99; CA1, p = 0.765; CC, p > 0.999; No Stim CK-p25 Vs GENUS CK-p25: V1, p = 0.0001; SS1, p = 0.035; CA1, p = 0.106; CC, p = 0.026; n.s.= not significant).
