
Figure 4. DP cells co-upregulates MAPK and STAT3 signaling pathways in multiple PDAC lines, in human primary tumors, and in a liver metastasis.
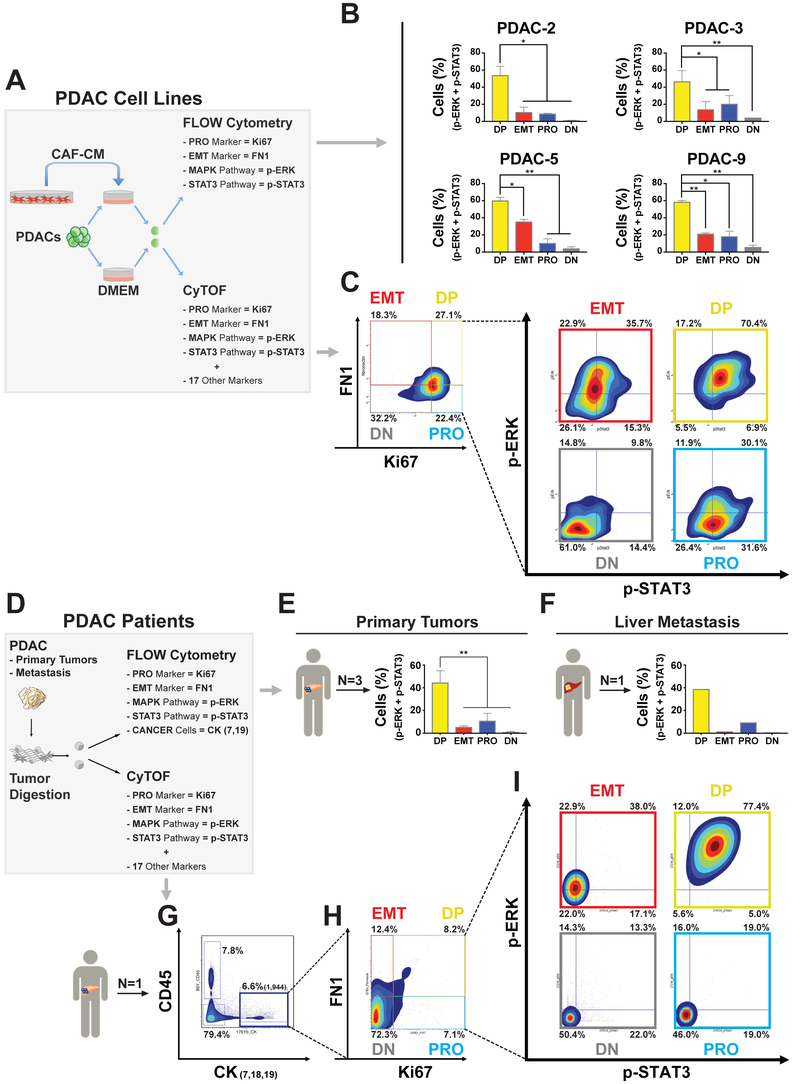
(A) Experimental schema of patient-derived PDAC cell lines exposed to CAF-1 conditioned media (CAF-CM) and analyzed for EMT (FN1), PRO (Ki67), MAPK (p-ERK), and STAT3 (p-STAT3) pathways with multiparameter flow cytometry or mass cytometry (CyTOF). (B) Bar graph (mean +/− SD) showing the percentages of DP (Ki67+/FN1+), EMT (−/FN1+), PRO (Ki67+/−) and DN (−/−) cells that have a coupregulation of both p-ERK and p-STAT3. *= p<0.05, **= p<0.01, two-tailed unpaired t-test. (C) Contour density plots showing Ki67 and FN1 positive subpopulations in PDAC-3 cells after 72 hours of CAF-CM exposure and contour density plots showing p-ERK and p-STAT3 activation in DP, EMT, PRO and DN subpopulation. (D) Experimental schema for human PDAC samples (primary tumors and a liver metastasis) analyzed for EMT (FN1), PRO (Ki67), MAPK (p-ERK), and STAT3 (p-STAT3) pathways with multiparameter flow cytometry (FN1, Ki67, p-STAT3, p-ERK, CK-7, and CK-19) or CyTOF. (E) Bar graphs (mean +/− SD) showing the percentages of DP (Ki67+/FN1+), EMT (−/FN1+), PRO (Ki67+/−) and DN (−/−) cells in three human primary PDAC tumors and (F) in a liver metastasis. (G) Contour density plots showing epithelial cancer markers (CK7,18,19)***** compared with white blood cell marker (CD45). (H) Quadrant analysis of gated CK7,18,19 cells for Ki67 and FN1 expression. (I) Contour density plots showing p-ERK and p-STAT3 activation in each cell phenotype (DP, EMT, PRO and DN) previously identified.