
Figure 1. Global fire map corresponding to September 8 to 17, 2015.
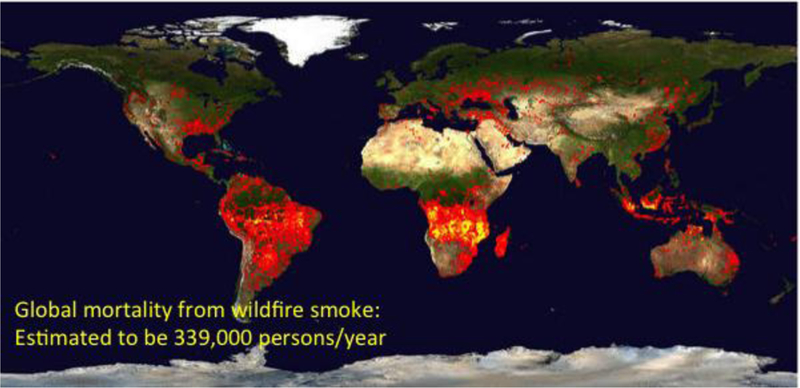
The global fire map (https://lance.modaps.eosdis.nasa.gov/cgi-bin/imagery/firemaps.cgi?period=2015251–2015260) reports the location of fires detected by MODIS (Moderate Resolution Image Spectroradiometer) on board NASA’s Terra and Aqua research satellites and shows the global expanse of wildfires. Each colored dot indicates a location where MODIS detected a fire during the 10-day period. Red dots indicate low fire counts, whereas yellow dots indicate larger numbers of fires. Global mortality from wildfire smoke is estimated to be 339,000 deaths annually (Johnson et al., 2012).