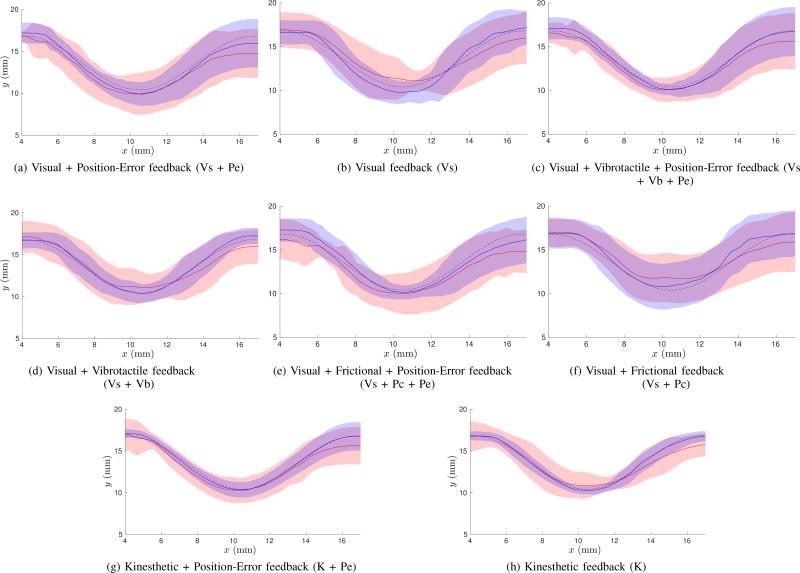
Fig. 7.
Experiment #1: path following task. The average trajectory of the reference point (blue curves) and the tracked gripper (red curves) along the x- and y-axes (solid lines) ± standard deviation (patches) along the y-axis is shown for each feedback condition for target trajectory 1 (black dashed lines). (a) Visual + position − error feedback (Vs + Pe). (b) Visual feedback (Vs). (c) Visual + vibrotactile + position − error feedback (Vs + Vb + Pe). (d) Visual + vibrotactile feedback (Vs + Vb). (e) Visual + frictional + position − error feedback (Vs + Pc + Pe). (f) Visual + frictional feedback (Vs + Pc). (g) Kinesthetic + position − error feedback (K + Pe). (h) Kinesthetic feedback (K).

