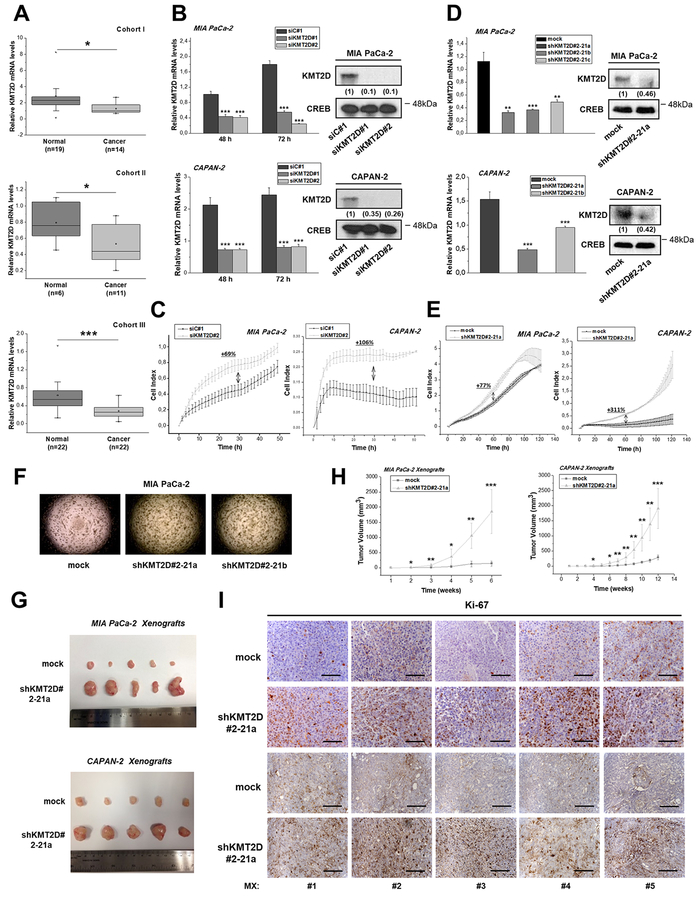
Figure 1. Histone methyltransferase KMT2D acts as a tumor suppressor in pancreatic cancer.
(A) KMT2D mRNA expression levels in 3 Cohorts of pancreatic cancer and normal tissues, as assessed by RT-qPCR. (B) Transient suppression of KMT2D expression by 2 different siRNAs in pancreatic cancer cells. Efficiency of KMT2D downregulation, as assessed by RT-qPCR (left panel) and by IB analysis (right panel). Whole cell protein extracts were analyzed by IB analysis for total KMT2D or CREB (used as a loading control). Numbers in parentheses denote the average-fold change of the ratio KMT2D:CREB total protein of siKMT2D-transiently transfected cells compared with siC#1-treated cells (set as default 1) of at least 2 independent experiments, as assessed by densitometric analysis of the immunoreactive bands. (C) Dynamic monitoring of cellular proliferation upon KMT2D transient suppression by using siKMT2D#2, using the xCELLigence RTCA SP system. (D) Assessment of KMT2D expression levels in MIA PaCa-2 cells transfected with #2–21 shRNA against KMT2D, that underwent clonal selection resulting in clones a, b and c, by RT-qPCR (left panel) and IB analysis (right panel). Numbers in parentheses denote the average-fold change of the ratio KMT2D:CREB total protein of shKMT2D-stably transfected cells compared with mock-treated cells (set as default 1), as assessed by densitometric analysis of the immunoreactive bands. (E) Dynamic monitoring of the proliferation of the shKMT2D#2–21a clonal pancreatic cancer cell lines versus mock transfected cells. (F) Effect of KMT2D stable suppression on soft agar colony formation. (G) Representative images of the excised tumors and (H) tumor volume (mm3) graphs of xenografts bearing KMT2D stably-suppressed MIA PaCa-2 and CAPAN-2 cells (n=5 mice per group). For establishing shKMT2D#2–21a xenografts, 3.5*106 MIA PaCa-2 or CAPAN-2 cells were injected subcutaneously in the right flank of NOD-SCID mice (5 mice/group). (I) Representative IHC images for the proliferation marker Ki-67, corresponding to MIA PaCa-2 (upper 2 rows) and CAPAN-2 (bottom 2 rows) xenografts from mice injected with mock or shKMT2D#2–21a cells. Scale bars represent 50 μm. siC#1, cells transfected with a negative control scramble siRNA; siKMT2D#1, cells transfected with siRNA#1 for KMT2D; siKMT2D#2, cells transfected with siRNA#2 for KMT2D; mock, cells transfected with shRNA empty vector; shKMT2D#2–21, cells transfected with #2–21 shRNA for KMT2D; shKMT2D#2–21a, b or c, cells transfected with #2–21 shRNA for KMT2D that underwent clonal selection resulting in clones a, b and c; MX, Mouse Xenograft. OD, Optical Density. Statistical analyses were performed using one-way ANOVA. Asterisks denote statistically significant differences, * P<.05, ** P<.01, *** P<.001

