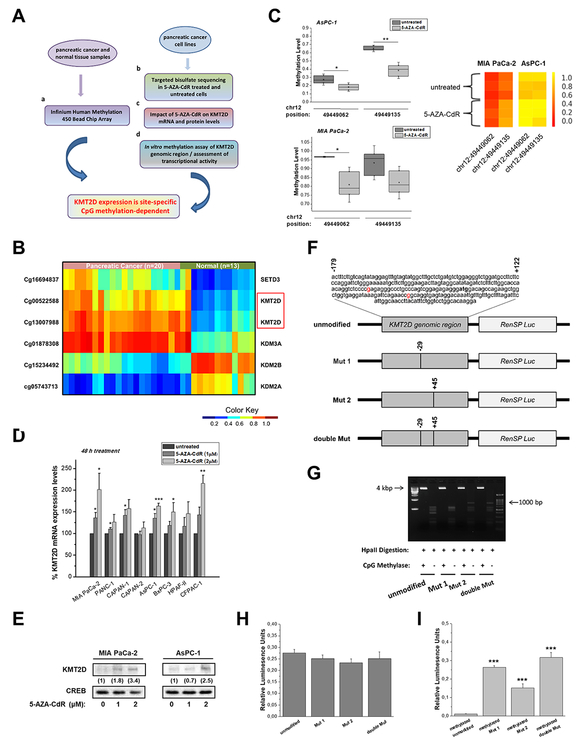
Figure 2. Epigenetic regulation of KMT2D levels through DNA methylation of 2 CpG sites.
(A) Experimental design for the evaluation of KMT2D transcriptional repression-dependency on CpG methylation in pancreatic cancer. (B) Heatmap of methylation beta values for the selected probes (P<.05, mean difference ≥.25). Wilcoxon rank-sum tests were conducted to compare methylation array data between pancreatic cancer patients and healthy controls. (C) Validation of CpG methylation levels via Targeted Bisulfite Sequencing for the selected ROI (chr12: 49448986–49449286). Quantitative methylation measurements at the single-CpG-site level for untreated or 5-AZA-CdR-treated cells are box plotted (left panel) or depicted as heatmaps of the methylation ratio (right panel). The color indicates the level of methylation from higher to lower in yellow > orange > red order. (D) Dose response evaluation of 5-AZA-CdR treatment for 48 h in KMT2D mRNA levels, as assessed by RT-qPCR. (E) Effect of 5-AZA-CdR treatment for 48 h on KMT2D protein levels, as assessed by IB analysis. Numbers in parentheses denote the average-fold change of the ratio KMT2D:CREB total protein in 5-AZA-CdR-treated cells compared with .005% DMSO-treated cells (set as default 1). (F) Schematic depiction of the distinct KMT2D/hRluc constructs used; the engineered hRluc was coupled to the genomic region (positions −179 to +121) of the human KMT2D gene. Tick marks represent the number and location of CpG dinucleotides. (G) The efficiency of CpG methylation was assessed in unmethylated and methylated, linearized and gel-purified constructs by resistance to digestion with Hpall endonuclease and subsequently agarose gel analysis. (H, I) Relative hRluc activity after in vitro methylation of KMT2D constructs using the promoterless pGL4.82 [hRluc/Puro] Vector gene system. HRluc mean fluorescence intensity was measured in MIA PaCa-2 cells transfected with either (H) untreated or (I) CpG methyltransferase (MSssl)-treated KMT2D/hRluc constructs. To control for transfection efficiency, cells were cotransfected with a plasmid containing firefly luciferase (Luc) reporter gene and the levels of hRluc fluorescence were averaged over all Luc expressing cells. Statistical analyses were performed using oneway ANOVA. Asterisks denote statistically significant differences, * P<.05, ** P<.01, *** P<.001

