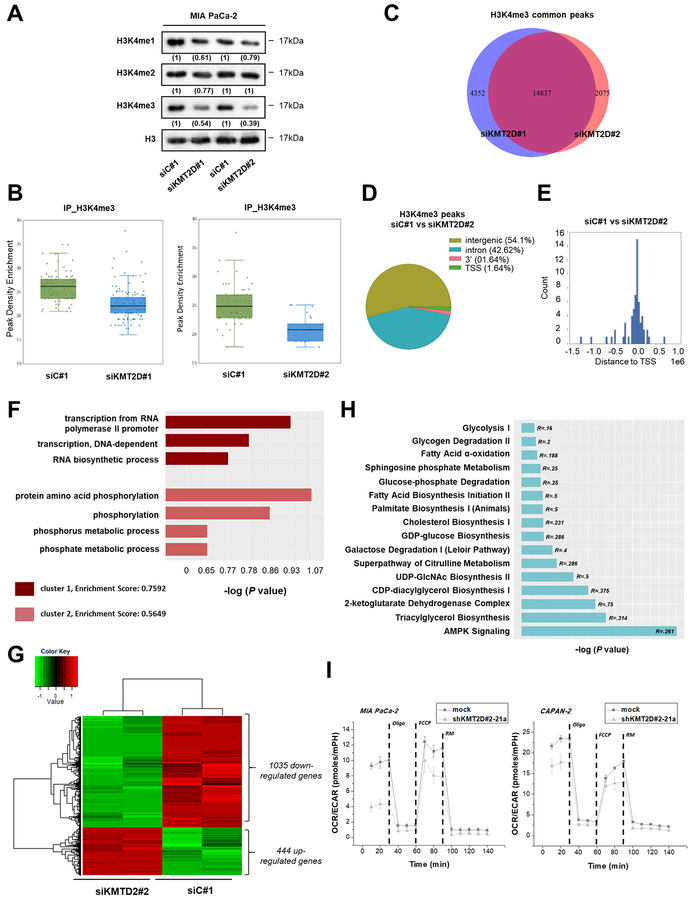
Figure 3. KMT2D-regulated pancreatic cancer cells’ transcriptome and epigenome.
(A) Effects of KMT2D silencing on the global levels of histone H3K4 mono-, di- and tri-methylation using IB analysis. Numbers in parentheses denote the average-fold change of the ratio H3K4me1, H3K4me2, orH3K4me3:H3 total protein in KMT2D-silenced cells versus siC#1-treated cells (set as default 1). (B) Enrichment scores comparing the read density conditions for each set of peak regions are shown in the jittered boxplots. The enrichment values were tested with the Mann-Whitney U test (P<.001). (C) Overlap of H3K4me3 peaks upon KMT2D suppression using 2 different siRNAs. (D) Effect of KMT2D silencing on the genomic distribution of H3K4me3 peaks in MIA PaCa-2 cells. Pie chart indicates the enriched H3K4me3 peaks in negative siRNA versus siKMT2D#2 treated cells. (E) Distribution of H3K4 tri-methylation mark around TSS. (F) GO terms associated with H3K4me3 binding sites were determined as follows; ChlP-seq peaks found in siC#1 treated cells versus peaks found in cells treated with siKMT2D#2 were associated with the nearest ENSEMBL transcript and processed using David (v6.7) tools. The data presented is log transformed P value of GO terms found to be enriched in the tested group of genes. (G) Heatmap showing the differentially expressed genes in MIA PaCa-2 cells upon KMT2D suppression. Data was filtered using a P value cutoff of .05 and a fold change cut-off of 2.0. Clustering dendrograms show the relative expression values according to the following coloring scheme: red = high, black=moderate, green=low. (H) List of metabolism-associated canonical pathways derived from Ingenuity Pathway Analysis (IPA) GO algorithms for the KMT2D-regulated genes (from Figure 3G). -log (P value) is measured by the bar length, while R refers to the number of molecules from the dataset that map to the pathway listed divided by the total number of molecules that map to the pathway from within the IPA knowledge base. (I) OCR/ECAR curves for KMT2D stably-transfected pancreatic cancer cells (Seahorse technology). R, Ratio; Oligo, Oligomycin; FCCP, Carbonyl cyanide-4-(trifluoromethoxy) phenylhydrazone; RM, Rotenone/Myxothiazol.

