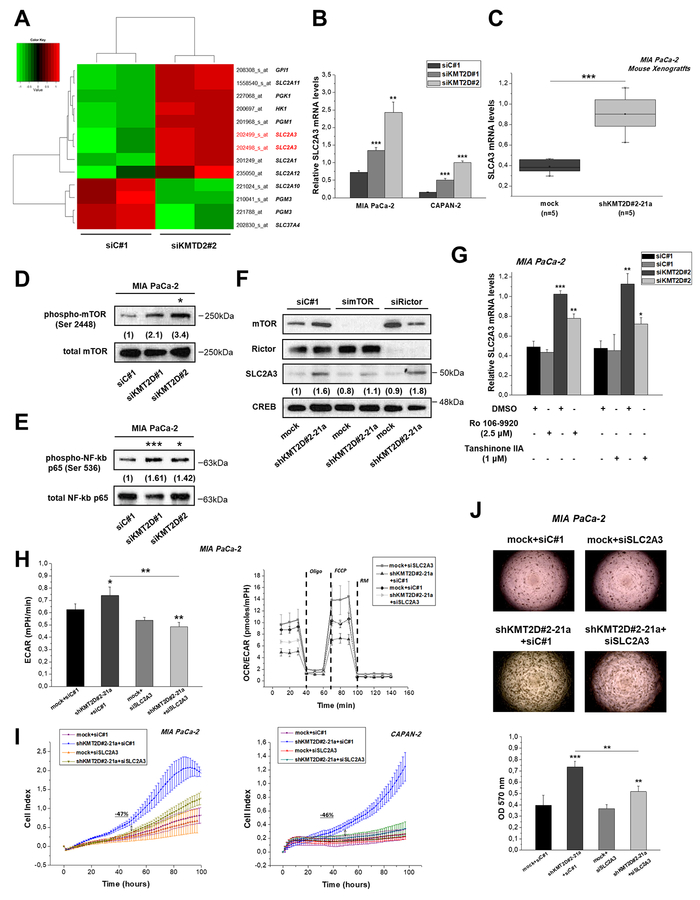
Figure 4. KMT2D regulates pancreatic cancer cell growth and metabolism by affecting SLC2A3 glucose transporter.
(A) Heatmap summarizing the differentially expressed glycolysis-related genes in MIA PaCa-2 cells upon KMT2D suppression. Data was filtered using a P value cutoff of .05 and a fold change cut-off of 1.25. (B) SLC2A3 mRNA expression in pancreatic cancer cells upon KMT2D silencing. (C) SLC2A3 expression in MIA PaCa-2 xenografts from mice injected with mock or shKMT2D#2–21a cells, as assessed by RT-qPCR. (D) Representative IB images for the activated and total (D) mTOR and (E) NF-kB p65 upon KMT2D silencing. Numbers in parentheses denote the average-fold change of the ratio phosphorylated: total protein of KMT2D-silenced cells versus siC#1-treated cells (set as default 1) of at least 2 independent experiments. (F) Representative IB images for SLC2A3, mTOR, Rictor and CREB protein levels upon treatment of MIA PacA-2 cells harboring differential KMT2D levels with siRNAs against mTOR, Rictor or the respective scramble control. Numbers in parentheses denote the average-fold change of the ratio SLC2A3:CREB total protein of siRNA-treated cells versus siC#1-treated cells (set as default 1). (G) Treatment of MIA PaCa-2 cells with inhibitors of NF-kB activation for 24 h reverses the KMT2D-mediated increase in SLC2A3 mRNA levels. Effects of SLC2A3 silencing on the (H) bioenergetic status, (I) proliferation and (J) colony formation ability of KMT2D-suppressed cells. Statistical analyses were performed using one-way ANOVA. Asterisks denote statistically significant differences, * P<.05, ** P<.01, *** P<.001

