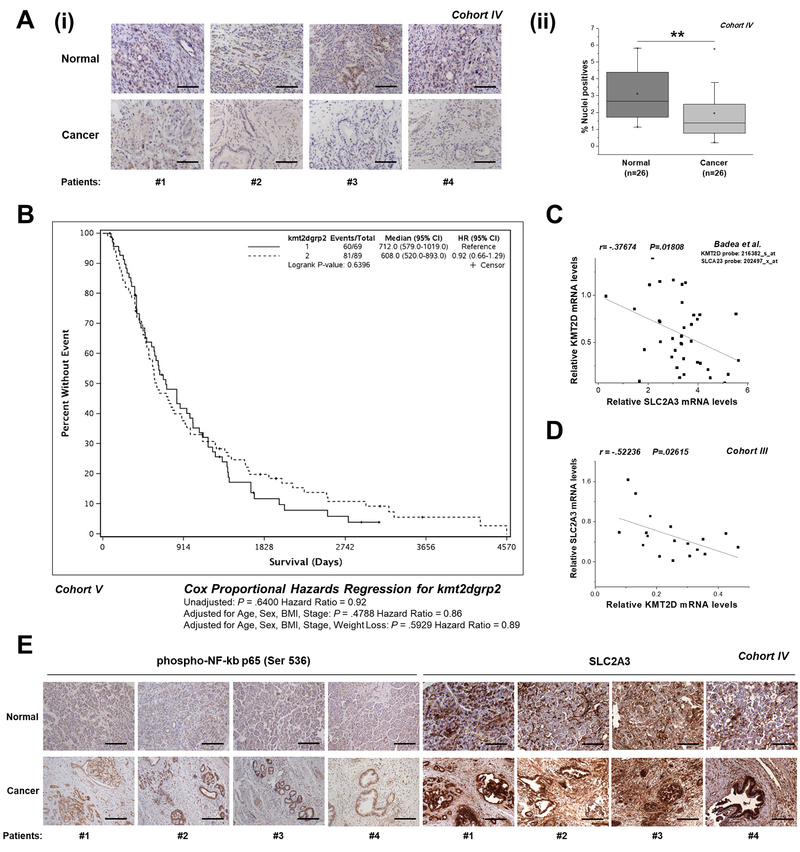
Figure 6. Correlation of KMT2D levels between its targets and disease aggressiveness.
(A) (i) Representative images (10x magnification) of KMT2D expression, as assessed by IHC analysis, in matched cancer and normal tissues from pancreatic cancer patients (Cohort IV). (ii) Automated image analysis using the Spectrum Software V11.1.2.752 (Aperio) was performed for nuclear staining quantification. (B) Correlation of KMT2D expression with overall patient survival. Kaplan-Meier survival curves of patients harboring below median (<3.917) and above median (>3.917) KMT2D levels derived from Cohort V. (C, D) Correlation of KMT2D levels with SLC2A3 expression in pancreatic cancer patients based on the study by Badea et al., 2008 [4] and as assessed by RT-qPCR (Cohort III). (E) Representative images (10x magnification) of phospho-NF-kB p65 (Ser 536) and SLC2A3 expression, as assessed by IHC analysis, in matched cancer and normal tissues from pancreatic cancer patients (Cohort IV). Scale bars represent 50 μm. r, Pearson correlation coefficient; The Kaplan-Meier test was used for univariate survival analysis. The Cox proportional hazard model was used for multivariate analysis and for determining the 95% confidence interval. Statistical analyses were performed using one-way ANOVA or Pearson correlation. Asterisks denote statistically significant differences, ** P<.01

