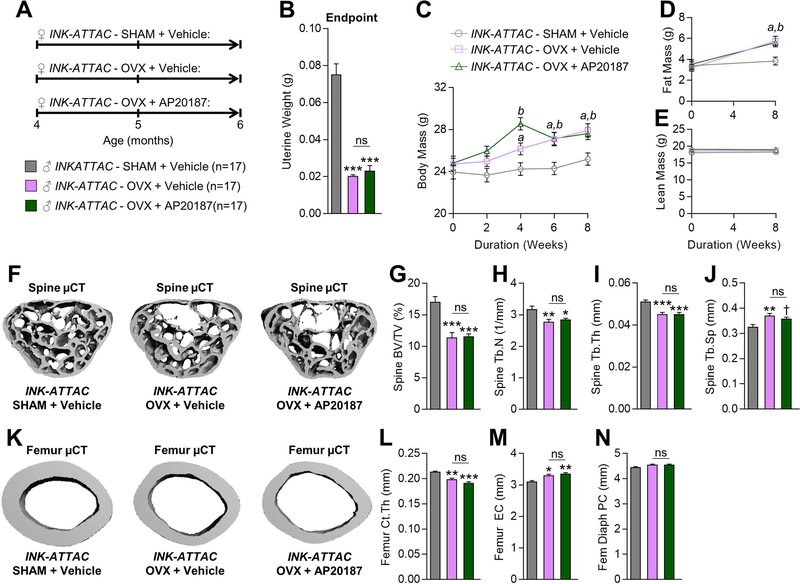
Fig. 4. Treatment with AP20187, which eliminates senescent cells in old INK-ATTAC mice, does not rescue ovariectomy (OVX)-induced bone loss in young mice.
(A) Experimental design for testing the effects of AP20187 treatment on OVX-induced bone loss; 4-month-old (Baseline) female INK-ATTAC mice were randomized to either SHAM+Vehicle (n=17), OVX+Vehicle (n=17), or OVX+AP20187 (n=17) for 8 weeks; all mice were sacrificed at age 6 months (Endpoint). Uterine weights (g) at study Endpoint in INK-ATTAC SHAM+Vehicle (n=17), INK-ATTAC OVX+Vehicle (n=17), and INK-ATTAC OVX+AP20187 mice. (C) Changes in total body mass (g) throughout the duration of the 8 wk study. (D) Changes in fat mass (g) from Baseline to study Endpoint. (E) Changes in lean mass (g) from Baseline to study Endpoint. (F) Representative micro-computed tomography (µCT) images of bone microarchitecture at the lumbar spine of INK-ATTAC SHAM+Vehicle (n=17), INK-ATTAC OVX+Vehicle (n=17), and INK-ATTAC OVX+AP20187 (n=17) mice. (G–J) Quantification of µCT-derived bone volume fraction (BV/TV; %) (G), trabecular number (Tb.N; 1/mm) (H), trabecular thickness (Tb.Th; mm) (I), and trabecular separation (Tb.Sp; mm) (J) at the lumbar spine. (K) Representative µCT images of bone microarchitecture at the femur diaphysis of INK-ATTAC SHAM+Vehicle (n=17), INK-ATTAC OVX+Vehicle (n=17), and INK-ATTAC OVX+AP20187 (n=17) mice. (L–N) Quantification of µCT-derived cortical thickness (Ct.Th; mm) (L), endocortical circumference (EC; mm) (M), and periosteal circumference (PC; mm) (N) at the femur diaphysis. (O–P) Quantification of plasma levels of markers of bone formation (amino-terminal propeptide of type I collagen [P1NP]) (O) and bone resorption (cross-linked C-telopeptide of type I collagen [CTx]) (P) in INK-ATTAC SHAM+Vehicle (n=17), INK-ATTAC OVX+Vehicle (n=17), and INK-ATTAC OVX+AP20187 (n=17) mice at study Endpoint. Data represent mean ± SEM (error bars); ns = not significant (p > 0.05). *p < 0.05; **p < 0.01; ***p < 0.001 (one-way analysis of variance [ANOVA] followed by Tukey post-hoc test to adjust for multiple comparisons). ap < 0.05 vs OVX+Vehicle vs SHAM+Vehicle (repeated measures ANOVA, followed by the Tukey post-hoc test to adjust for multiple comparisons); bp < 0.05 vs OVX+Vehicle vs SHAM+Vehicle (repeated measures ANOVA, followed by the Tukey post-hoc test to adjust for multiple comparisons).

