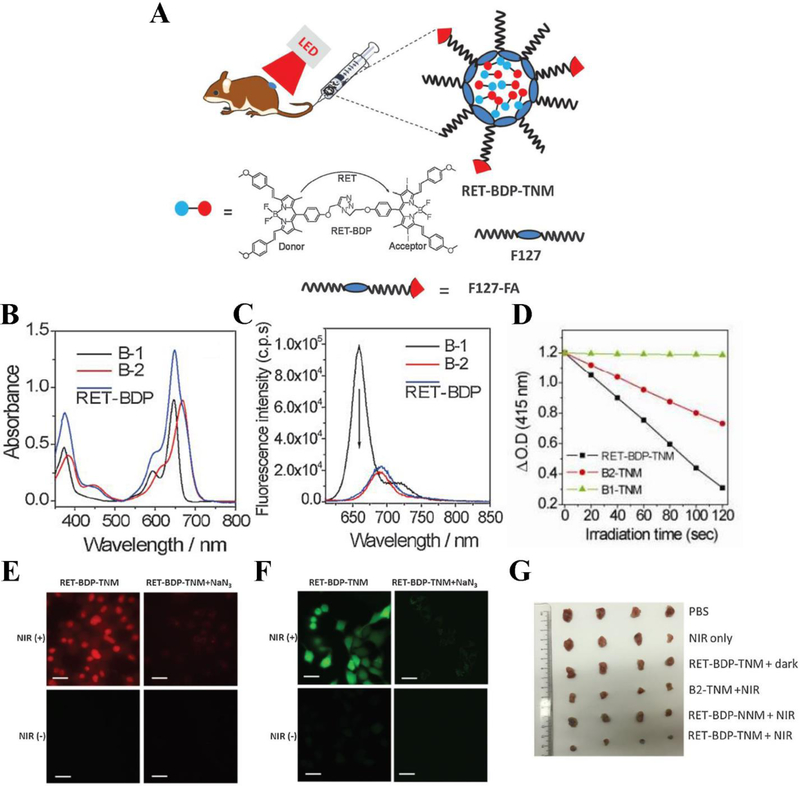
Figure 4.
(A) Concept and structure of RET-BDP-TNM. (B) Absorption spectra of donor moiety B-1, acceptor moiety B-2, and RET-BDP. (C) Fluorescence emission spectra of donor moiety B-1, acceptor moiety B-2, and RET-BDP upon excitation with 610 nm light. (D) The change of DPBF optical density vs irradiation time for mixtures of DPBF with RET-BDP-TNM, B1-TNM, and B2-TNM respectively, upon excitation with 645 nm light (10 mW cm−2). (E) PDT effect of RET-BDP-TNM in HeLa cells with PI staining for dead cells observed by confocal fluorescence microscopy. (F) ROS generation of RET-BDP-TNM in HeLa cells measured by DCFH-DA. (G) digital pictures of 4T1 tumors with different treatments. Scale bar represents 30 μm. Reproduced with permission (L. Huang et al., 2017). Copyright 2017, John Wiley and Sons.

