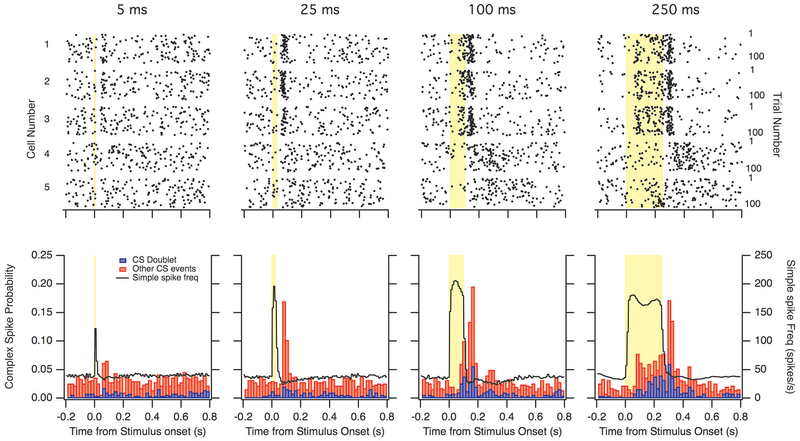
Figure 2.
Optogenetic simple spike activation increased complex spikes. Optogenetic stimulation of Purkinje cells with 5, 25, 100 and 250 ms duration (n=5). Top: Raster plots depicting complex spike firing during each trial. Bottom: Histograms showing the probability of a complex spike occurring (red) and the probability of complex spikes occurring within 150 ms of each other (blue). Black curve shows the firing rate of simple spikes. Yellow bar indicates the time of stimulation. The bar graphs are unstacked.

