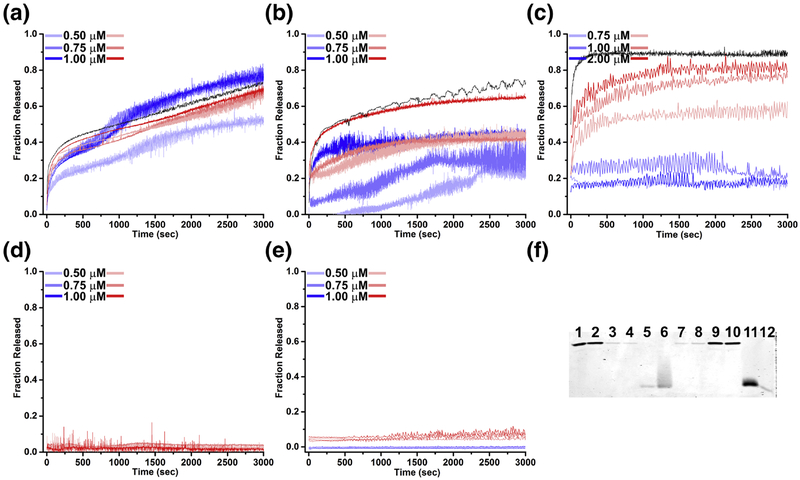
Figure 2.
Liposome disruption and fluorophore release by PCV2 VLP and components of the capsid protein. The fraction of fluorophore release as compared to the liposome disruption by addition of 1% triton x-100 is represented. Red and blue shades represent fluorescence traces of fluorophore release from 200 nm DOPC:DOPG (75:25) liposomes at pH 7 and 5 respectively. a) VLP, b) capsid protein (CPfl), c) ARM peptide, d) VLP ARM, e) C-terminus peptide. Black curve in panel b and c represent fluorescence traces of fluorophore release from DOPC:DOPG:DOPG-PEG2000 (75:20:5) by capsid protein (CPfl) and ARM peptide, respectively. f) SDS-PAGE of the liposome pelleting assay to assess the association of ARM peptide, Lane 1 and 2: VLP supernatant at pH 7 and 5, Lane 3 and 4: CPfl supernatant at pH 7 and 5, Lane 5 and 6: ARM peptide supernatant at pH 7 and 5, Lane 7 and 8: VLP with liposome at pH 7 and 5, Lane 9 and 10: CPfl with liposome at pH 7 and 5, Lane 11 and 12: ARM peptide with liposome at pH 7 and 5.

