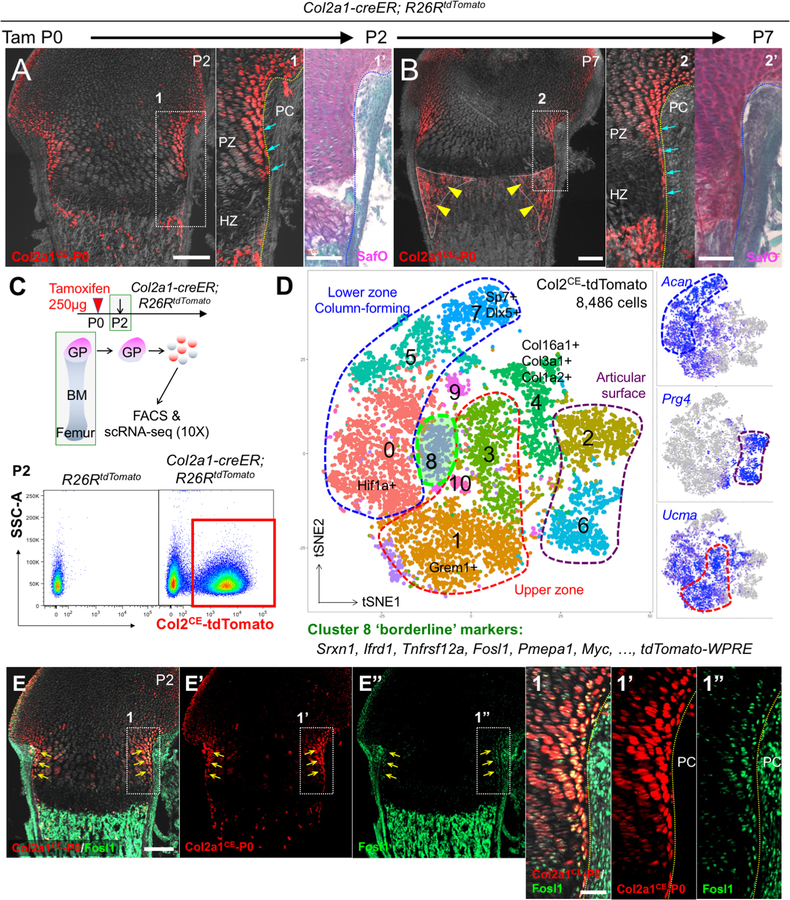
Figure 1. Single cell RNA-seq characterization of neonatal growth plate chondrocytes.
(A,B) Cell-fate analysis of Col2a1-creER+ neonatal growth plate chondrocytes (P0-pulsed) at P2 (A) and P7 (B). PC: perichondrium, PZ: proliferating zone, HZ: hypertrophic zone. Right panels: SafraninO & FastGreen staining of identical sections. Arrows: tdTomato+ borderline chondrocytes, arrowheads: tdTomato+ cells in peripheral metaphyseal marrow space. Scale bars: 200μm (left panels), 100μm (right panels). n=3 mice for each experiment.
(C,D) Single cell RNA-seq analysis of Col2a1-creER+ neonatal growth plate chondrocytes. (D) t-SNE-based visualization of major classes of FACS-sorted Col2a1CE-tdTomato+ single cells at P2 (Cluster 0–10). Cluster 0,5,7: lower zone column-forming chondrocytes, Cluster1,3: upper zone chondrocytes, Cluster 2,6: articular surface chondrocytes, Cluster 4: collagen-rich articular cells, Cluster 8: borderline chondrocytes, Cluster 9,10: cells in cell cycle. Dots: individual cells, color: cell type. Green contour: borderline chondrocytes. Right panels: feature plots of Acan, Prg4 and Ucma. Blue: high expression, grey: no expression. n=8,486 cells.
(E) In situ validation of the identified marker, Fosl1. Col2a1-creER; R26RtdTomato distal femurs at P2 (P0-pulsed). (E’,E”): tdTomato, Fosl1-Alexa488 single channel, (1–1”): magnified views of the dotted area. Scale bars: 200μm (E-E”), 50μm (1–1”). n=3 mice.

