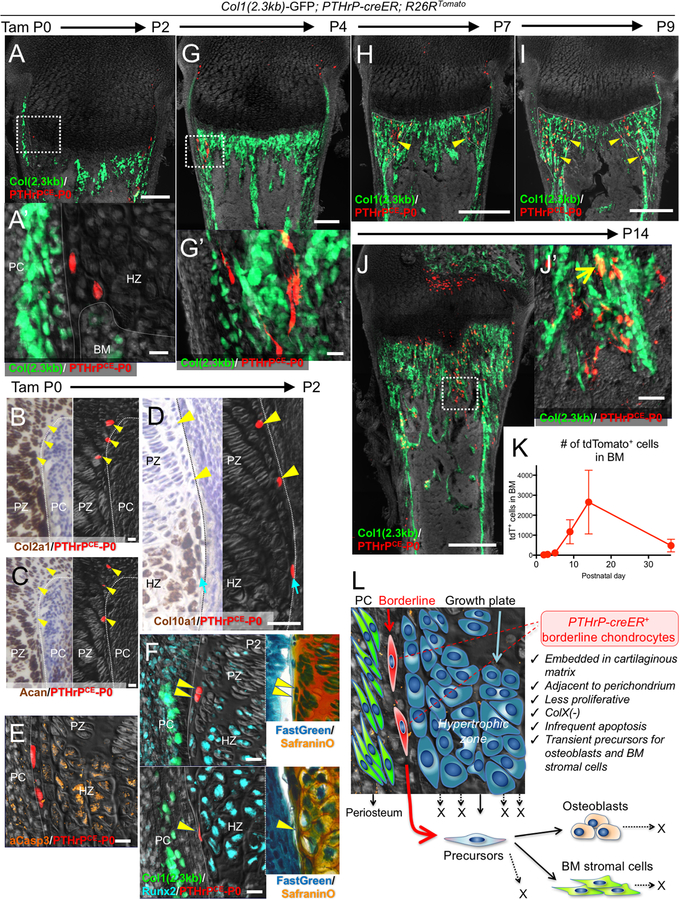
Figure 2. Pthrp-creER+ borderline chondrocytes in the neonatal stage behave as transient mesenchymal precursor cells.
Cell-fate analysis of Pthrp-creER+ borderline chondrocytes (P0-pulsed) at P2 (A-F), P4 (G), P7 (H), P9 (I) and P14 (J). (A,F-J): Col1(2.3kb)-GFP; Pthrp-creER; R26RtdTomato distal femurs, (B-E): Pthrp-creER; R26RtdTomato distal femurs. (A’,G’,J’): magnified views of the dotted areas. In (B-D), left panels (bright field) and right panels (dark field) represent the identical sections. Right panels in (F): SafraninO & FastGreen staining of left panels. Arrowheads in (B-F): tdTomato+ borderline chondrocytes denoting identical cells. PC: perichondrium, PZ: proliferating zone, HZ: hypertrophic zone. Arrowheads in (H,I): tdTomato+ cells in peripheral metaphyseal marrow space, arrow in (J): GFP+tdTomato+ osteoblasts. Scale bars: 200μm (A,G), 500μm (H-J), 20μm (A-F), 50μm (J’). n=3 mice for each experiment. (K): Quantification of tdTomato+ marrow cells at each time point. n=6 (P2), n=4 (P4), n=3 (P5, P9, P14, P36) mice, data are presented as mean ± S.D. (L): Concluding diagram. Borderline chondrocytes in growth plates can translocate into marrow space and behave as transient precursors for osteoblasts and stromal cells by escaping hypertrophy and apoptosis.

