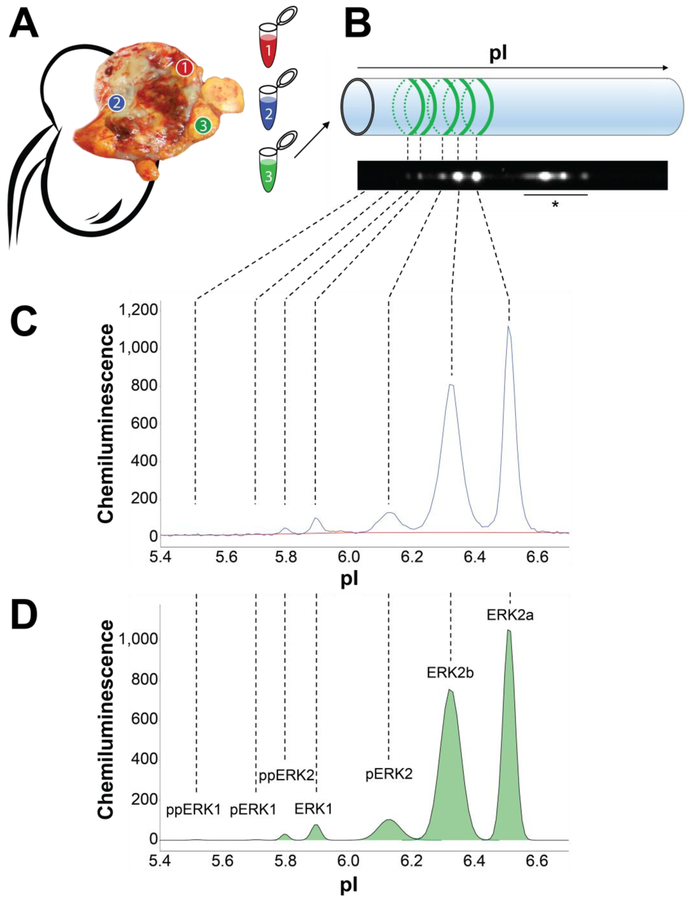
Fig. 1 –
Multiregion FNA sampling and nanoimmunoassay analysis. (A) Immediately after surgical extirpation, the sample was bivalved and FNA biopsies were obtained in grossly representative regions. (B) FNAs were lysed and analyzed using charge separation by isoelectric focusing. ERK isoforms were detected by chemiluminescence using a pan-ERK antibody. (C) NIA chemiluminescence intensity trace (blue curve) of one representative RCC FNA. Background intensity was subtracted by using a baseline fit (red curve). (D) Area under the curve (green) was calculated for each peak using a fitted curve (black), and peaks were assigned to specific ERK isoforms according to their isoelectric point (pI). Percent phosphorylation was calculated by dividing the area under the curve of each isoform by the sum of the area of all isoforms of ERK1 or ERK2, respectively. ERK = extracellular signal-regulated kinase; FNA = fine needle aspirate; RCC = renal cell carcinoma. * Nonspecific antibody binding.

