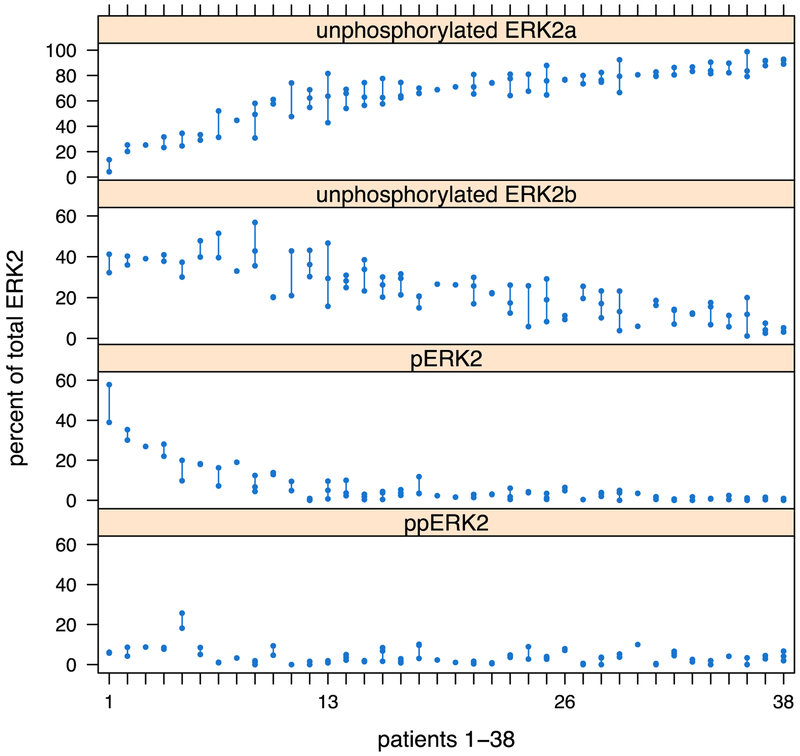
Fig. 2 –
Variation in ERK2 phosphorylation across 90 fine needle aspirates from 38 clear cell RCC tumors. Each column represents an individual tumor, while each dot representing a distinct region sampled. Differences between regions of the same tumor are illustrated by the line connecting each dot. Overall, variability between tumors was much higher than that seen across regions of an individual tumor. ERK = extracellular signal-regulated kinase; RCC = renal cell carcinoma.

