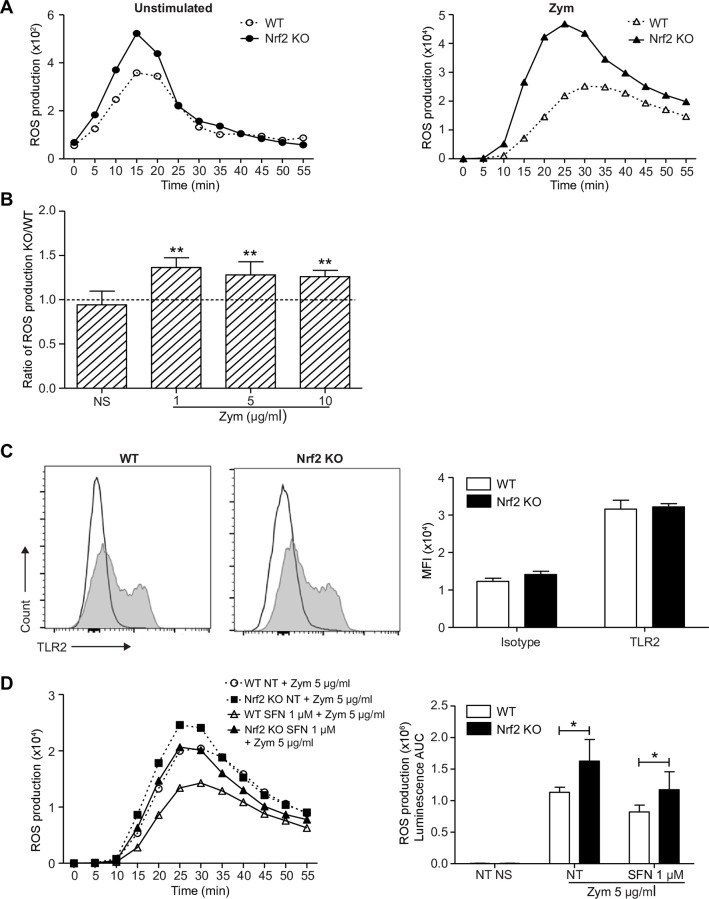
Fig 3. Nrf2 activation decreases PMN ROS production in response to zymosan.
WT and Nrf2 KO PMNs were stimulated or not with increasing concentrations of zymosan. The sum of intra- and extracellular ROS was monitored for 60 min by the luminol-amplified chemiluminescence assay. (A) Graphs from one representative experiment show the kinetic of ROS production in unstimulated PMNs (left panel) or in response to zymosan 10 μg/ml (right panel). (B) The area under curve (AUC) from the kinetic curves of 6 independent experiments was used to calculate the ratio of ROS production (KO AUC/WT AUC). Ratios greater than 1 correspond to higher ROS production in KO PMNs (**p<0.01, Mann-Whitney test). (C) The expression of TLR2 was assessed on freshly isolated WT and Nrf2 KO PMNs (grey filled curves) in comparison to corresponding isotypes (black unfilled curves). The associated graph represents the mean ± SEM of TLR2 MFI, n = 4. (D) To ensure an important Nrf2 accumulation, PMNs were pretreated or not (NT) with SFN 1 μM for 4 h then stimulated with 5 μg/ml of zymosan. ROS production was then measured for 60 min by the luminol-amplified chemiluminescence assay. Graphs show the kinetics of ROS production from one representative experiment (left panel) and the mean ± SEM of AUC from the kinetic curves of 6 independent experiments (right panel, n = 6; *p<0.05, Mann-Whitney test).

