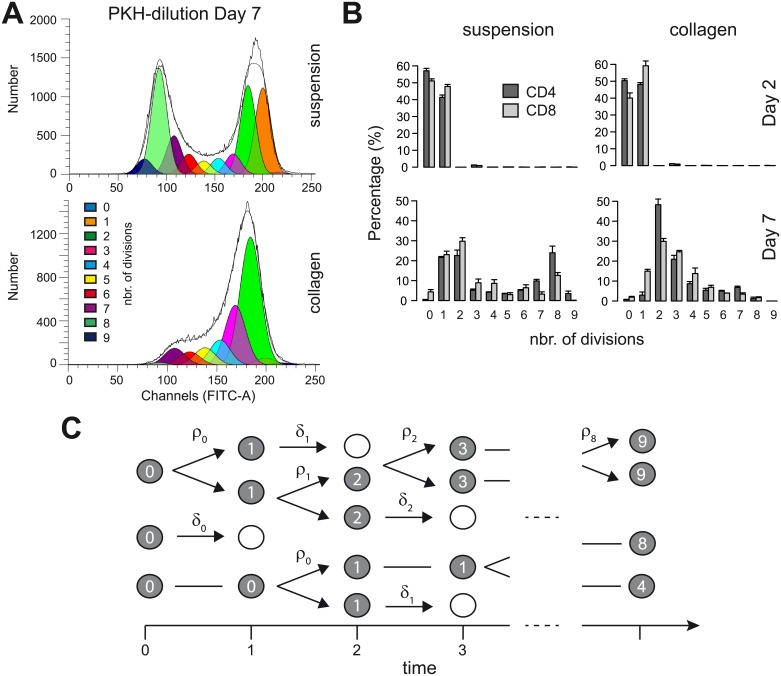
Fig 5. Assessing cell proliferation dynamics by dye dilution experiments within different culture conditions.
(A) Representative plot for PKH-distribution and separation for cellular subsets according to the number of divisions 7 days after the transfer of the cells. (B) Distribution for CD4+ and CD8+ T cells according to the number of divisions either in 2D suspension (left column) or 3D ex vivo collagen cultures (right column) at 2 and 7 days post transfer of the cells. (C) Schematic representation of the proliferation dynamics. Cells are assumed to proliferate or die with division dependent proliferation (ρ) and death rates (δ), respectively.

