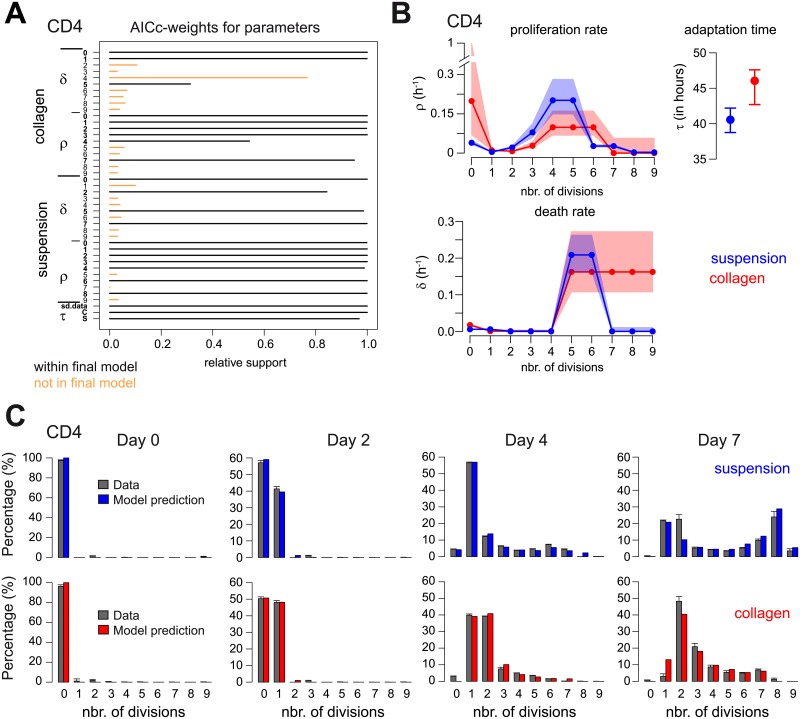
Fig 6. Assessing cell proliferation dynamics of CD4+ T cells by dye-dilution experiments within different culture conditions.
(A) Akaike weights for the individual parameters based on all 8669 model evaluations within the 5 independent FAMoS runs performed for the analysis of the CD4+ T cells. Parameters selected within the final model (depicted by 2 out of 5 runs) are shown in black, non-selected parameters in orange. A representative FAMoS run is shown in S2 Fig. (B) Determined model structures and parameter estimates for the generation-dependent proliferation (ρ) and death rates (δ), as well as adaptation time periods (τ) for CD4+ T cells within suspension (blue) and collagen (red). Points indicate best parameter estimates obtained for each rate with shaded areas defining the corresponding 95%-confidence intervals obtained by profile-likelihood analyses (see Table 1 and S3 Fig). (C) Observed (grey) and predicted distribution of cell populations for CD4+ T cells using the determined model structure and the best parameter estimates obtained for each condition (blue = suspension, red = collagen).

