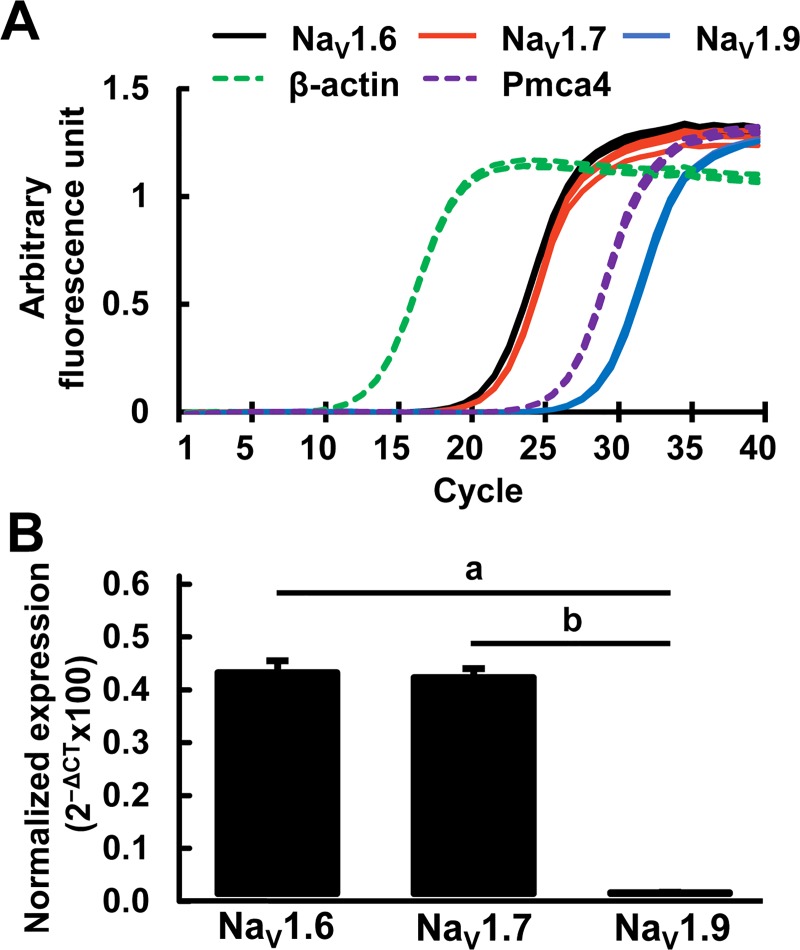
Fig 3. Quantitative RT-PCR analysis of NaV1.6, NaV1.7, NaV1.9 sodium channel transcripts in ND7/23 cells.
(A) Real-time change in fluorescence with PCR cycle number in a representative of qRT-PCR experiment. Each primer set was determined in technical triplicates and data are plotted as lines. β-actin and Pmca4 (Plasma membrane calcium ATPase4) were controls. (B) Relative expression of NaV1.6, NaV1.7, NaV1.9 transcript averaged from three independent experiments (total RNA samples) and each data point (ie, primer set) was averaged from technical triplicates and normalized to reference gene (β-actin). Mean±SD (n = 3); Comparisons by one way ANOVA followed by post-hoc Student’s t-test with Bonferroni correction. a,b, p < 0.001.

