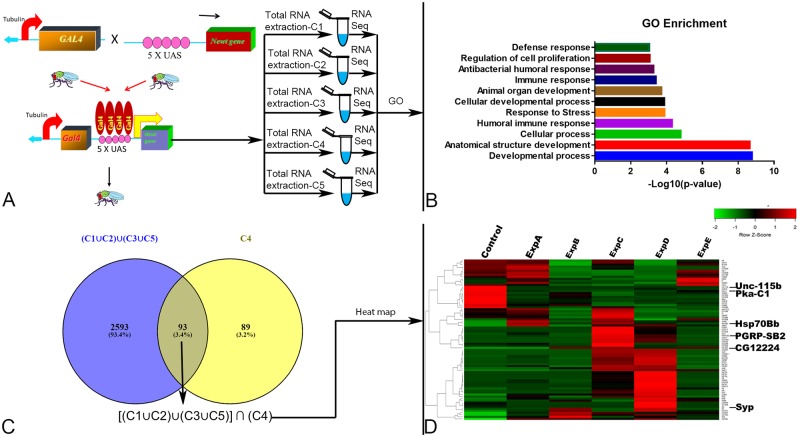
Fig 3. Targeted misexpression of newly identified Newt gene family in Drosophila using Gal4/UAS binary system followed by next generation RNA sequencing.
(A) Schematic representation of misexpressing Newt genes ubiquitously in Drosophila using Tubulin driver. It was followed by collection of sample for RNA sequencing at 3rd instar stage [29]. (B) Bar graph showing enriched gene ontology (GO) terms on the scale of–Log10 (p-value). (C) Venn diagram showing 93 selected genes (D) Heat map constructed (for 93 common transcripts) from the expression profiles of the 6 sequenced samples. Control: Tubulin Gal4/S-T, Exp A: Candidate 1/Control, ExpB: Candidate 2/Control, ExpC: Candidate 3/Control, ExpD: Candidate 4/Control, ExpE: Candidate 5/Control respectively. Heat map was divided into cluster A: showing genes upregulated by misexpression of C4, and Cluster B: showing genes downregulated by misexpression of C4. The location of the genes used for RT- qPCR analysis is shown on the heat map.

