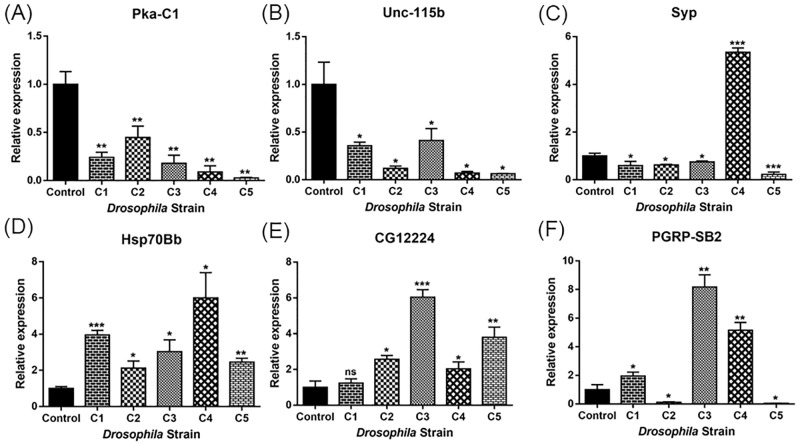
Fig 4. RT-qPCR expression validation of (A) Pka-C1 (B) Unc-115b (C) Syp (D) hsp70Bb (E) CG12224 (F) PGRP-SB2.
Expression of the different genes at the RNA level is indicated as relative expression. Bars indicate standard deviation. Statistical test was performed with two-way ANOVA and Student’s t-test. Asterisks above the bars indicate statistical significance (*: p<0.05, **: p<0.005, ***: p< 0.0005) between control: Tublin Gal4/S-T and experimental: C1, C2, C3, C4, and C5 respectively). Total RNA was extracted from 5 larvae for each sample on same day.

