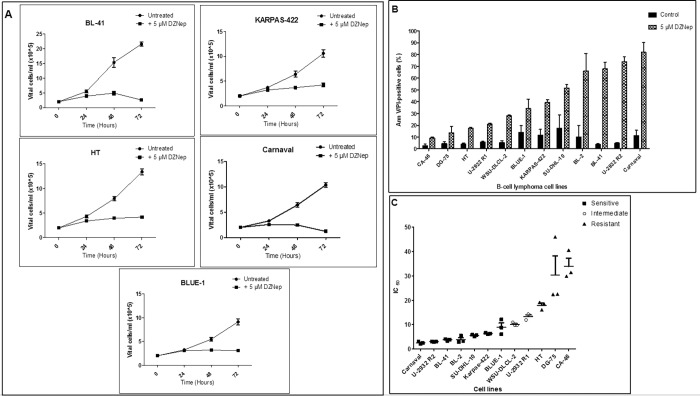
Fig 3. Impact of DZNep treatment on proliferation and apoptosis.
(A) Cell lines were seeded at a density of 2 x 10⁵ vital cells / ml. They were either untreated or treated with 5 μM DZNep on day 0. The number of vital cells was determined after 24 hours, 48 hours and 72 hours. The number of vital cells was recorded after exclusion of the apoptotic / dead cell population (annexin V/PI positive cells) by flow cytometry. (B) Cell lines were either untreated or treated with 5 μM DZNep for a duration of 72 hours. The percentage of apoptotic cells was measured using flow cytometry. (C) IC50 determination and grouping of the cell lines into DZNep-sensitive, an intermediate and DZNep-resistant. For Fig 3A, 3B and 3C, data is shown as mean plus SD, n = 3 biological replicates.

