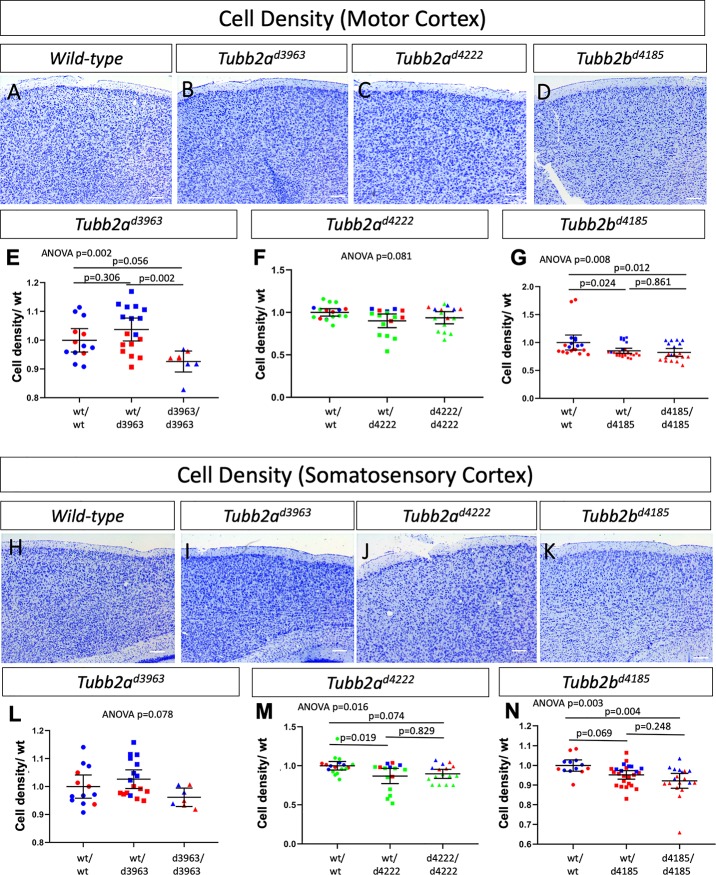
Fig 3. Quantitative analysis of cell density in the motor and somatosensory cortex in Tubb2a and Tubb2b deletions alleles.
Quantification of Nissl-positive cells/area for both the motor cortex (A-G) and somatosensory (H-N) cortex show some changes in cellular density. ANOVA p values are shown for each experiment and multiple comparison p values are shown when ANOVA p≤0.05. (Individual samples are plotted to indicate sample size, differing colors in E-G, L-N indicate littermates. n = 3 wild-type, 3 heterozygotes and 3 homozygous mutants for Tubb2ad3963; 4 wild-type, 4 heterozygotes and 4 mutants for Tubb2ad4222; and 4 wild-type, 5 heterozygotes, and 4 mutants for Tubb2bd4185).

