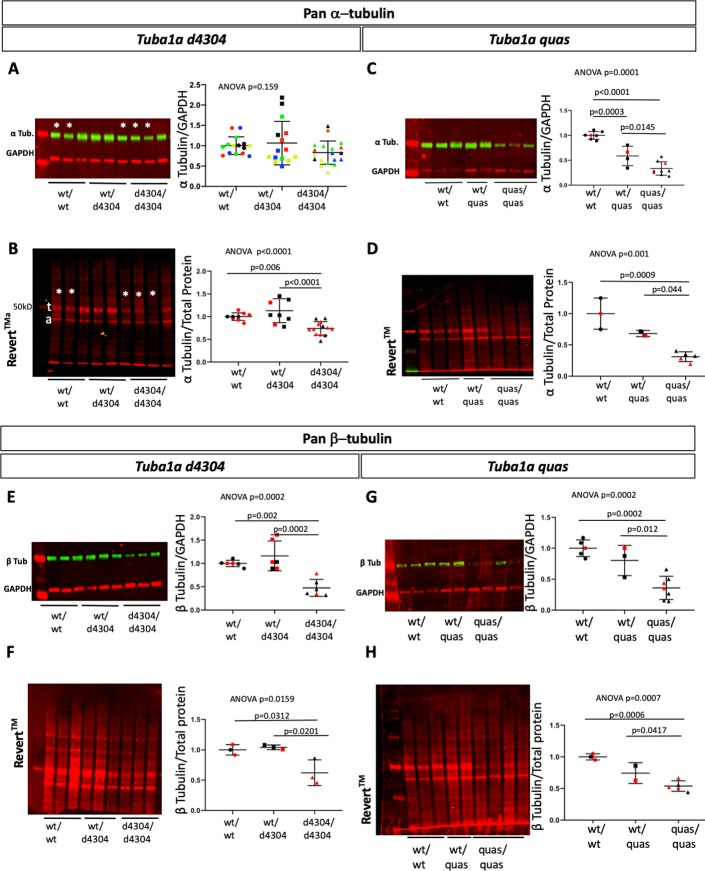
Fig 10. Total α-tubulin and β-tubulin protein levels in Tuba1a mutants.
Immunoblotting for pan-α (A-D) and pan-β (E-H) tubulin in Tuba1ad4304 (A,B,E,F) and Tuba1a quas (C,D,G,H) wild-type, heterozygous and mutant embryos. Protein levels were quantified by comparison to GAPDH loading control (A,C,E,G) and REVERT total protein stain (B,D,F,H). (A) Colors indicate results from five different technical replicates. (B-H) Colors indicate littermates (technical replicates are shown for A-C,E,G). For Tuba1ad4304, n = 3 animals of each genotype, for Tuba1aquas, wild-type n = 3, heterozygous n = 2, and mutant n = 5. (t = presumed tubulin protein, a = presumed actin protein).

