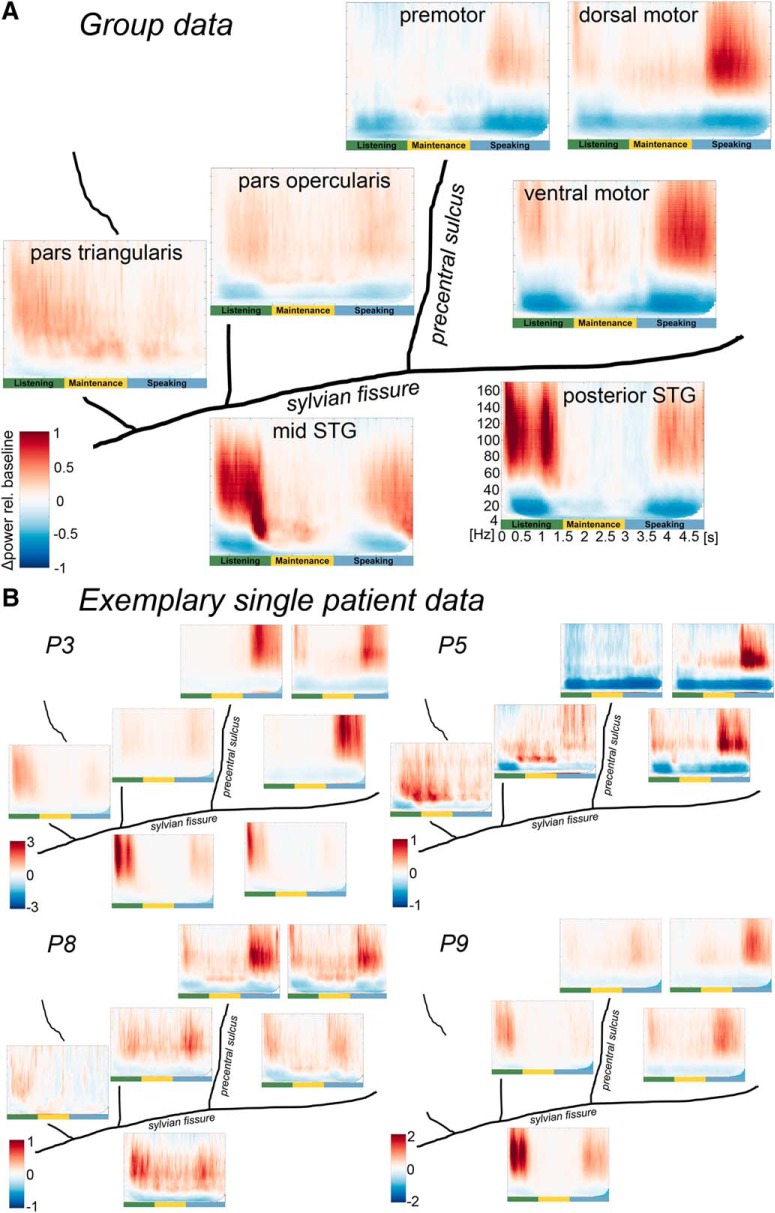
Figure 2.
Group-averaged (A) and exemplary single patient (B) time frequency-resolved data of left perisylvian ECoG during sentence reproduction. All panels: Left to right, Rostrocaudal axis. Top to bottom, Dorsoventral axis. Plots represent averages over clusters of electrodes that share the same spectral pattern over time within an anatomical region. Power is color-coded as the relative change per cent compared with baseline. A value of 1 indicates a change of 100%. Frequency on the y axis (4–160 Hz), time on the x axis (0–5 s with trials locked to auditory sentence onset). Trial phases are illustrated in green (listening), yellow (maintenance), and blue (speaking).

