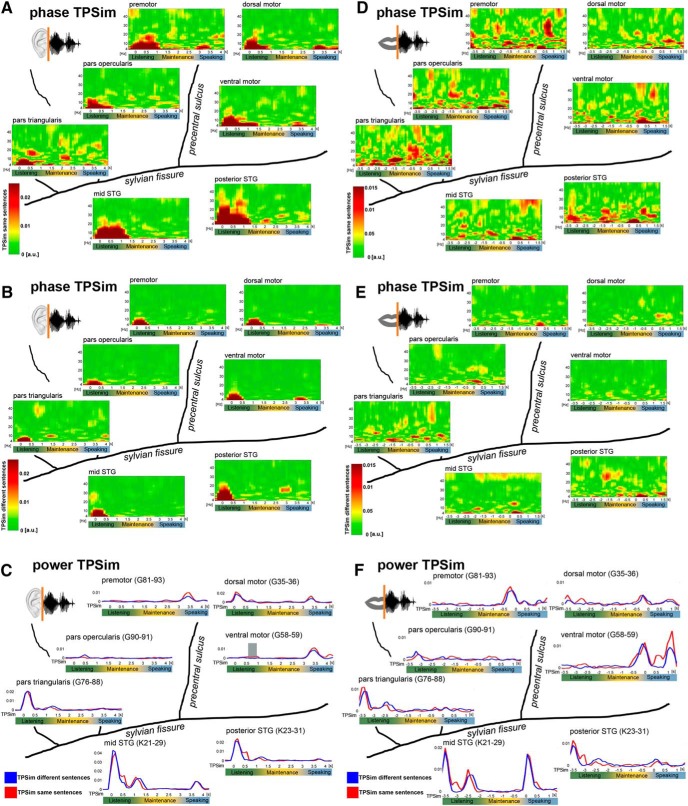
Figure 5.
Input- and output-related phase and power TPSim. Time points on the x axes correspond to the center of the 500 ms analysis window. A, B, Input-related phase TPSim based on the complex coefficient phase-locking value of the time frequency-resolved data in the low-frequency range (4–48 Hz) of same (A) and different (B) sentence trials. Trials were time-locked on the auditory stimulus onset (0 s). Plots represent averages over electrodes and patients. D, E, Output-related phase TPSim based on the complex coefficient phase-locking value of the time frequency-resolved data in the low-frequency range (4–48 Hz) of same (D) and different (E) sentence trials. Trials were time-locked on individual speech onset (0 s). Plots represent averages over electrodes and patients. Input-related (C) and output-related (F) gamma power TPSim (70–170 Hz) of same (red) and different sentence trials (blue). C, Trials were time-locked on stimulus onset (0 s). F, Trials were time-locked on individual speech onset (0 s). Gray shaded area represents significant ΔTPSim time intervals (p = 0.0243, corrected, ventral motor cortex in C). Plots illustrate representative single electrodes in participant 3.

