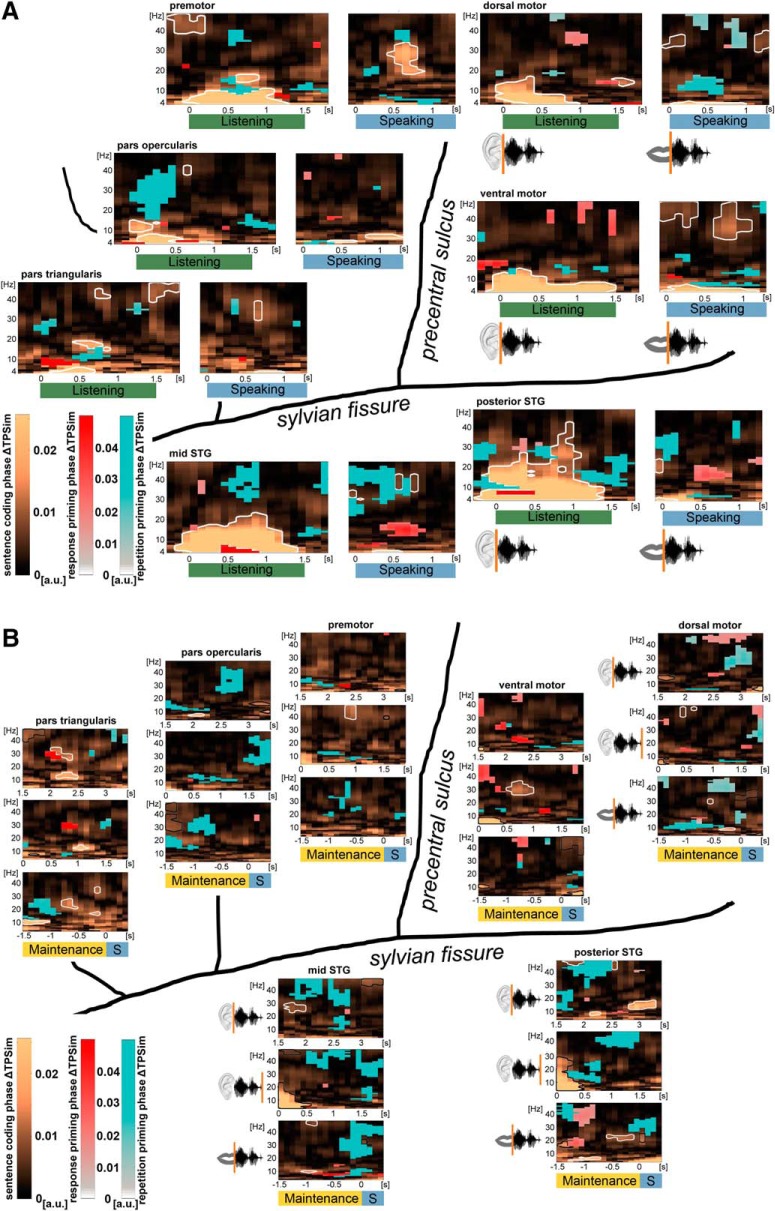
Figure 6.
A, Response and repetition priming phase ΔTPSim during speech perception and production: group data of left perisylvian ECoG. Plots represent averages over electrodes and participants. For perception-related response and repetition priming phase ΔTPSim during listening (green), trials were time-locked on stimulus onset; whereas for the analysis of production-related response and repetition priming during speaking (blue), trials were time-locked on individual speech onsets. The analysis was performed on the complex coefficient phase-locking value of the time frequency-resolved data in the low-frequency range (4–48 Hz). Significant clusters (p < 0.01, stepwise Bonferroni-corrected) reflecting response priming (red) and repetition priming (blue) are overlaid onto the phase ΔTPSim analyses on sentence identity (related to Fig. 3). Time points on the x axes correspond to the middle of the 500 ms analysis window. B, Response and repetition priming phase ΔTPSim during verbal WM: group data of left perisylvian ECoG. Plots represent averages over electrodes and participants during WM maintenance with trials time-locked on the stimulus onset (0 s, top panels), on the different stimulus offsets (0 s, middle panels), and on the individual speech onsets (0 s, bottom panels). The analysis was performed on the complex coefficient phase-locking value of the time frequency-resolved data in the low-frequency range (4–48 Hz). Significant clusters (p < 0.01, stepwise Bonferroni-corrected) on response priming (red) and repetition priming (blue) are overlaid onto the phase ΔTPSim analyses, reflecting sentence identity coding during verbal WM (related to Fig. 4). Time points on the x axes correspond to the middle of the 500 ms analysis window. S, Speaking.

