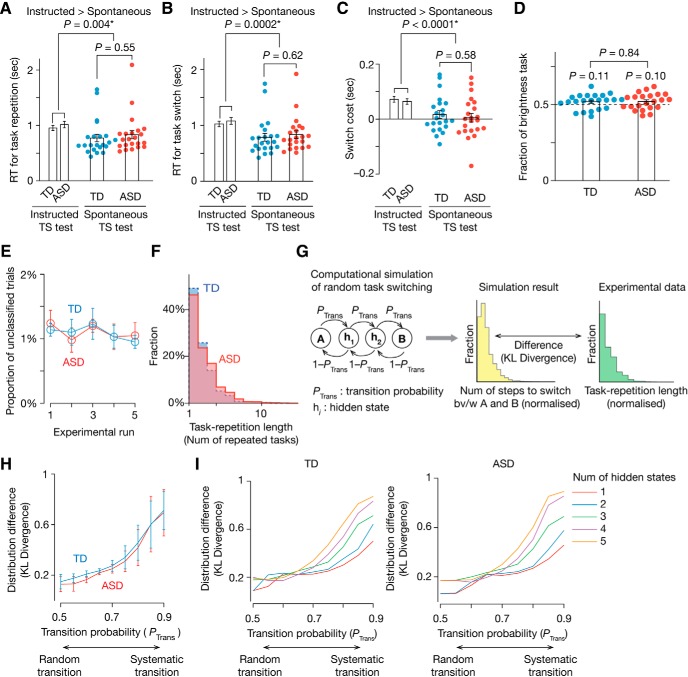
Figure 4.
Validation of spontaneous TS test. A–C, In the spontaneous TS test, ASD and TD participants repeated the tasks more quickly (A) and switched them more smoothly (B) than in the instructed TS test. The switch cost was not significantly different from zero and significantly less than in the instructed TS test (C). These results suggest that the participants repeated and switched the tasks spontaneously. *PBonferroni < 0.05. D, The ASD and TD participants performed the two types of task at almost equal frequencies. Error bars indicate SEM. E, The mean proportion of the unclassified trials in the spontaneous TS test was <1.5% throughout the test and not different between the ASD and TD groups. Error bars indicate SD. F–I, In both the participant groups, the task repetition length showed a skewed, long-tailed distribution (F). To evaluate the randomness of the task switch, we compared the distribution with that seen in one-dimensional Markov-chain random walk simulations (G). When the simulation adopted more random transition probability (e.g., PTrans = 0.5), the difference between the distributions (KL divergence) became smaller (H). The lines in the H show the mean KL divergence across different numbers of the hidden states varying between 1 and 5 shown in the I. Error bars indicate SEM.

