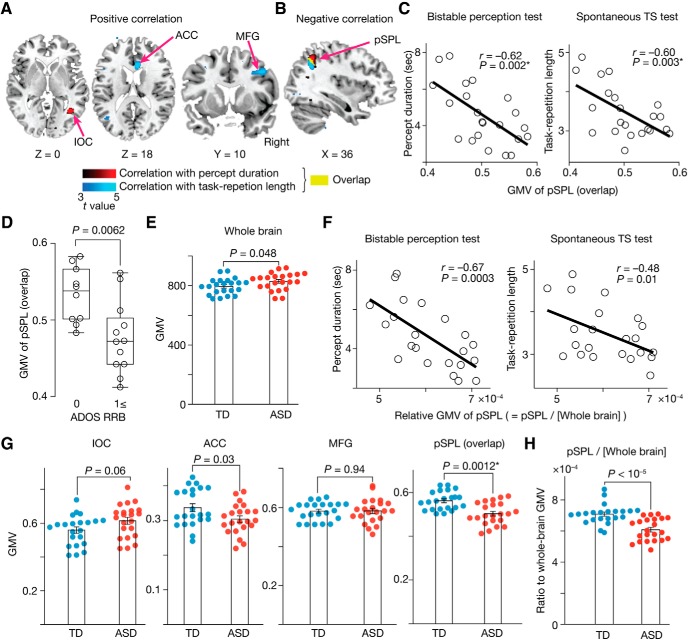
Figure 6.
Neuroanatomical results. A, B, Red areas indicate voxels with GMVs that were significantly correlated with the median percept duration in the bistable perception test; blue areas indicate those with GMVs that were significantly correlated with the median task repetition length in the spontaneous TS test. The yellow area was an overlap between the red and blue regions (center, [36, −53, 44] in MNI coordinates, pSPL). For presentation purposes, the statistic brain maps adopted t = 3.0 as their thresholds. See also Table 3 for details. C, The GMV of the overlapping pSPL region was negatively correlated with both the percept duration and task repetition length. D, The GMV of the overlapping pSPL was significantly smaller in ASD individuals with severer RRB symptoms. E, The whole-brain GMV was marginally larger in the ASD group. Error bars indicate SEM. F, The relative GMV of the pSPL, a ratio of the GMV of the pSPL to the whole-brain GMV, still shows significant negative correlations with the median percept duration in the bistable perception test (left) and the median task repetition length in the spontaneous TS test (right). Each circle represents each individual with ASD, G, Among the four regions, the pSPL was the only region with a GMV that was significantly different between the ASD and TD groups. Error bars indicate SEM. *PBonferroni < 0.05. H, The relative GMV of the pSPL was significantly smaller in the individuals with ASD compared with the controls. Error bars indicate SEM.

