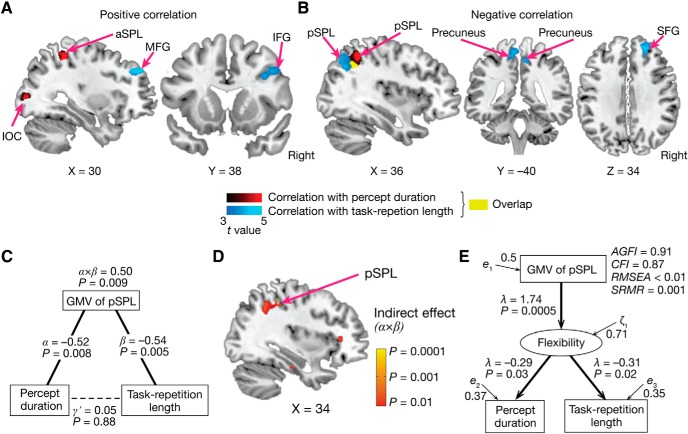
Figure 9.
Neuroanatomical results based on TD data. A, B, The GMVs in the red areas were correlated with the median percept duration in the bistable perception test, whereas those in the blue areas were correlated with the median task repetition length in the spontaneous TS test. The yellow area was an overlap between the red and blue clusters. The overlapping area (B) was located around [34, −46, 40] in MNI coordinates. For presentation purpose, the statistic brain maps adopted t = 3.0 as their thresholds. aSPL/pSPL, anterior/posterior superior parietal lobule; SFG, superior frontal gyrus. See also Table 4 for details. C, A nonparametric mediation analysis suggests that, even in TD individuals, the pSPL is a mediator linking perceptual stability to cognitive rigidity. For the details of the analysis and abbreviations, see the legend for Figure 7B. D, Colored clusters are brain regions with GMVs that had significant indirect effects (α×β) in a whole-brain nonparametric mediation analysis. For presentation purposes, the statistic brain map adopted p = 0.01 as its threshold. A significant cluster was found in the pSPL (p = 0.0008 in [36, −52, 38] in MNI coordinates). E, A structural equation modeling analysis indicates that the pSPL could be related to domain general behavioral/mental flexibility even in TD individuals. For the details of the analysis and abbreviations, see the legend for Figure 7D.

