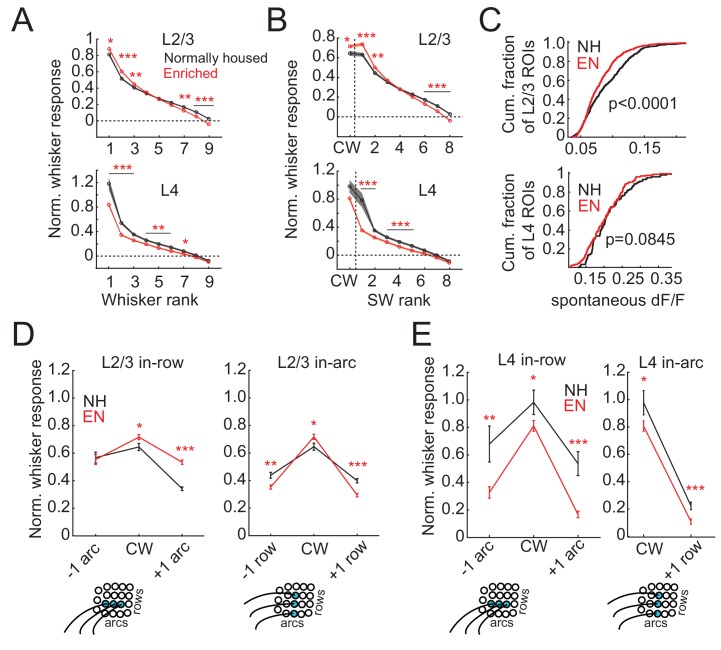
Figure 4. Enrichment sharpens whisker tuning curves.
(A) Mean receptive field for all responsive ROIs, calculated after ranking whiskers from strongest to weakest in each cell and normalizing median responses to spontaneous activity. Asterisks, significant difference between EN and NH, computed separately by permutation test for each whisker rank. *p<0.05, **p<0.01, ***p<0.001. (B), Mean receptive fields separated into CW and ranked SW whiskers. (C) Effect of enrichment on spontaneous activity, defined as median ΔF/F during blank trials. P-values computed by permutation test. (D) Mean responses of L2/3 ROIs to CWs and adjacent whiskers within the same row (left) or the same arc (right). Lower panels: schematics of adjacent whiskers within rows or arcs on the whisker pad. (E) As in D, for L4 ROIs. Only columns containing at least 3 ROIs were included in this analysis. Because most ROIs were located in the C row, no data was available for responses to surround whiskers within the same arc but −1 row relative to the CW. Asterisks, significant difference between EN and NH. *p<0.05, **p<0.01, ***p<0.001.


