. 2019 Aug 16;8:e46321. doi: 10.7554/eLife.46321

Figure 5. Enrichment alters the spatial structure of signal and noise correlations in L2/3.

(A) Mean signal correlation across responsive L2/3 cell pairs as a function of inter-ROI distance, for cell pairs within a column (left) or across columns (right). Shaded regions denote SEM. Dashed, number of cell pairs in each bin. Insets show schematic of cell locations. (B) Mean noise correlation across all responsive L2/3 pairs, plotted as in (A). (C–D) Cumulative distribution of signal correlation (C) or noise correlation (D) for all within-column (in-col) and across-column (x-col) pairs. Asterisks denote difference between distributions computed by ANOVA with multiple comparisons correction. (E) Spatial map of mean signal correlation for sample ROIs within a position bin to all ROIs located within a reference whisker column. For each sample ROI, the mean signal correlation to all ROIs within the reference column was calculated. Sample ROIs were then clustered into spatial bins, and the mean signal correlation for each bin was plotted. The dashed circle is the reference column (shown as an average barrel diameter around the column center). (F) Spatial map of mean noise correlation to all ROIs within the reference whisker column, shown as in (E). (G) Mean signal correlation from sample ROIs to all cells in a reference column, as a function of sample ROI distance from column center. Shading is SEM. (H) Same as for (G), but for noise correlations. G-H show that enrichment steepens correlation gradients at column edges.

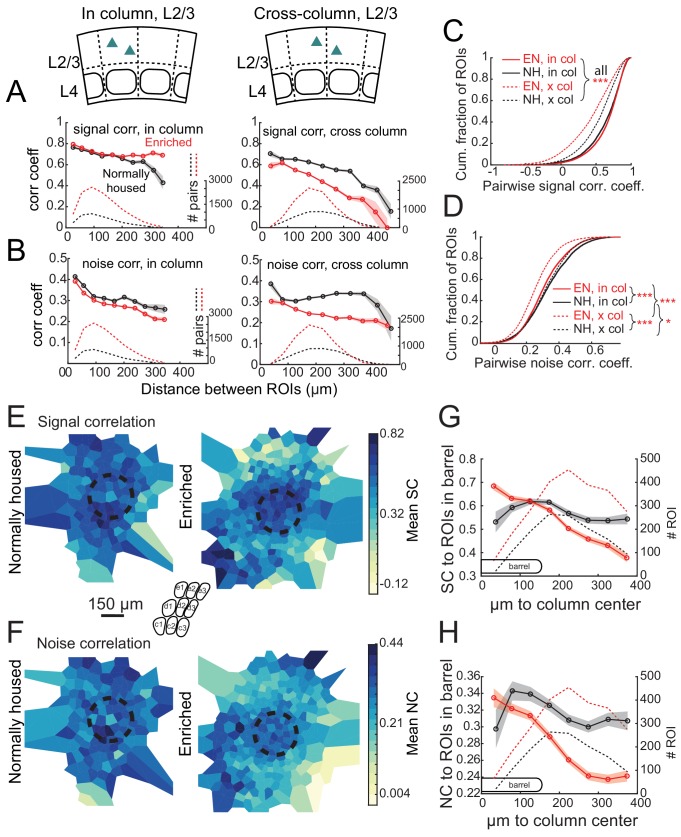
Figure 5.

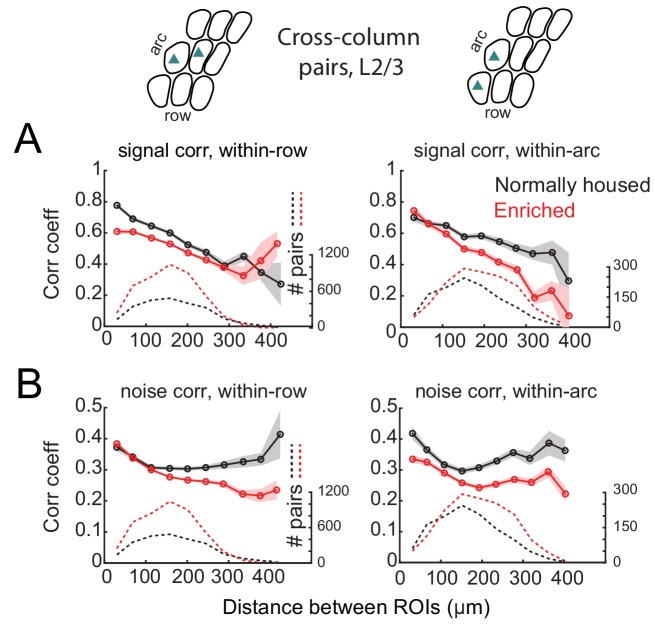
Figure 5—figure supplement 1. Spatial structure of signal and noise correlations across rows and arcs in L2/3.

Figure 5—figure supplement 1.

(A) Mean signal correlation across responsive L2/3 cell pairs located across columns as a function of inter-ROI distance, for cell pairs across columns within a row (left) or across columns within an arc (right). Shaded regions denote SEM. Dashed, number of cell pairs in each bin. Insets above plots show schematic of cell locations. (B) Mean noise correlation across all responsive L2/3 pairs located across columns within a row (left) or within an arc (right), plotted as in (A).
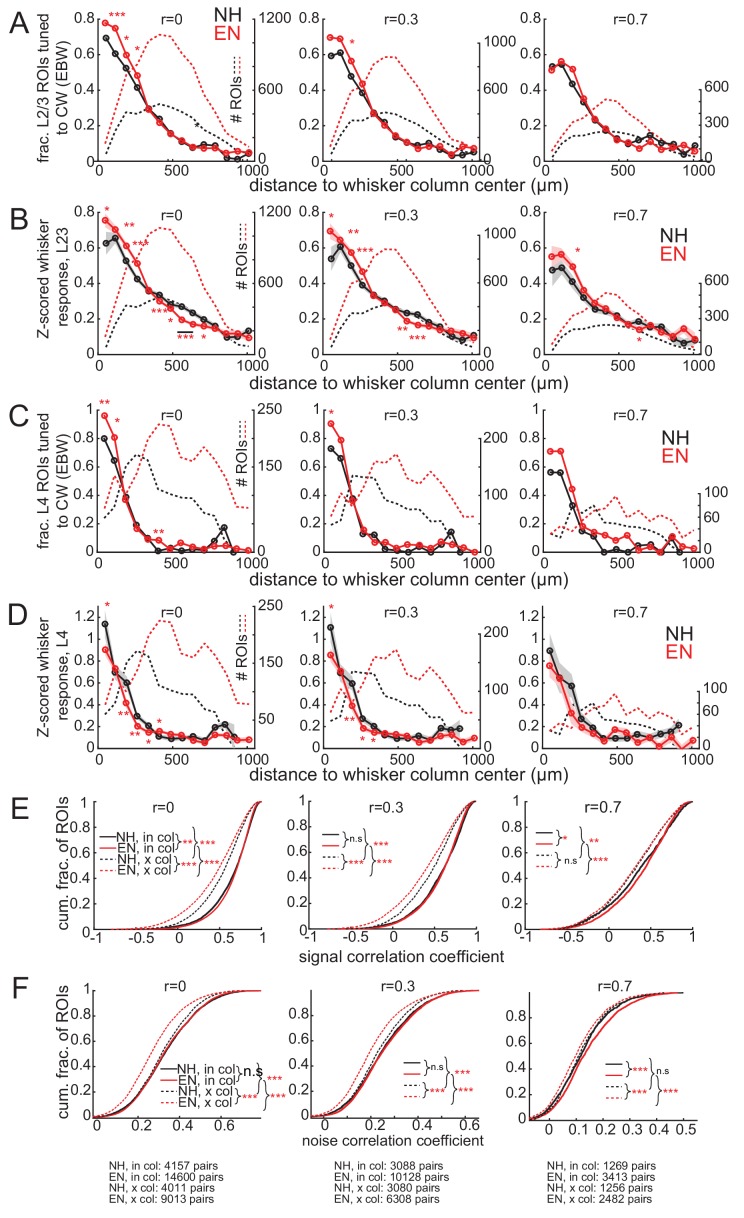
Figure 5—figure supplement 2. Neuropil subtraction minimally impacts the major effects of the study.

Figure 5—figure supplement 2.

(A–F) The principal effects of EN recalculated under different levels of neuropil subtraction. Neuropil subtraction was performed by calculating the raw fluorescence of each ROI on each frame F(t)ROI as F(t)ROI=F(t)ROImask-r*F(t)NPmask. Left column, r = 0 (no neuropil subtraction). Middle column, r = 0.3. Right, r = 0.7. (A) Fraction of L2/3 PYR ROIs tuned to a reference whisker, calculated as in Figure 3A. Asterisks show significant differences between EN and NH by Fisher’ Exact Test, computed separately in each spatial bin. *p<0.05, **p<0.01, ***p<0.001. (B) Mean response evoked by a reference whisker, calculated and plotted as in Figure 2A. (C) Same as in (A), but for L4 excitatory cells. (D) Same as in in (B), for L4 excitatory cells. (E–F) Distribution of signal correlation (E) or noise correlation (F) for all within-column (in-col) and across-column (x-col) L2/3 PYR pairs. Plotted as in Figure 5D and E. Asterisks denote difference between distributions computed by ANOVA with multiple comparisons correction. The bottom row in (F) reports numbers of pairs of significantly whisker-responsive ROIs at each neuropil subtraction weight.