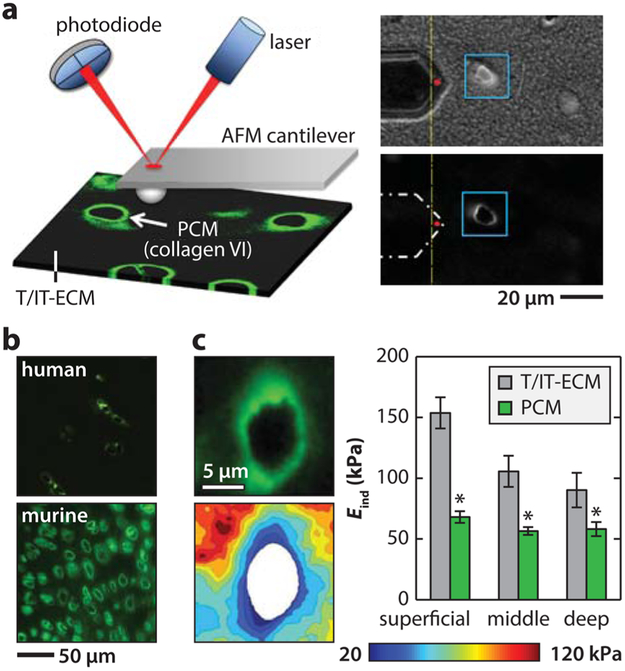
Figure 4.
Immunofluorescence (IF)-guided AFM nanomechanical mapping of cartilage elastic modulus. (a) Left panel: schematic of the IF-guided AFM on cryo-sectioned cartilage. Right panel: phase contrast (top) and IF images of type VI collagen illustrating the PCM and territorial/interterritorial ECM (T/IT-ECM) during AFM tests. Adapted with permission from ref 109. Copyright 2013 Elsevier Ltd. (b) Comparison of the IF-labeled adult human and murine cartilage images shows the much higher density of cells and PCM regions in the murine tissue. Adapted with permission from ref 72. Copyright 2013 Osteoarthritis Research Society International (human cartilage image only; murine cartilage image is original). (c) Left panel: representative modulus map and IF image of porcine cartilage section with a PCM terrain surrounding a cell-sized void. Right panel: elastic indentation modulus, Eind, of T/IT-ECM versus PCM in different depth-dependent zones of cartilage (mean ± SEM for 20 images per zone from n = 5 mice, *p < 0.05 between T/IT-ECM and PCM; whereas the ECM shows significant depth-dependent variations, the PCM exhibits zonal uniformity). Adapted with permission from ref 105. Copyright 2012 The Royal Society of Chemistry.

