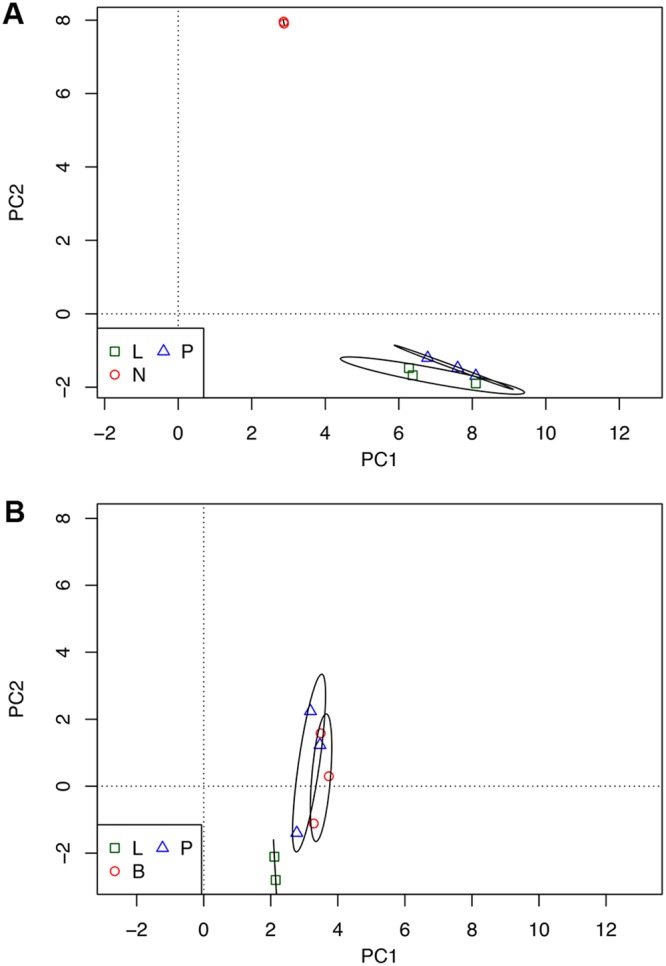
FIG 1.

Principal-component analysis of the transcriptional profile of host and bacterial cells before and after infection. (A and B) Graphs plot the two largest principal components of the normalized transcriptome profiles of host (A) and bacterial (B) cells. Ellipses surround the 95% confidence limits of the centroids of the groups. L, lung samples; P, pleural samples; N, resting neutrophil samples; B, broth samples.
