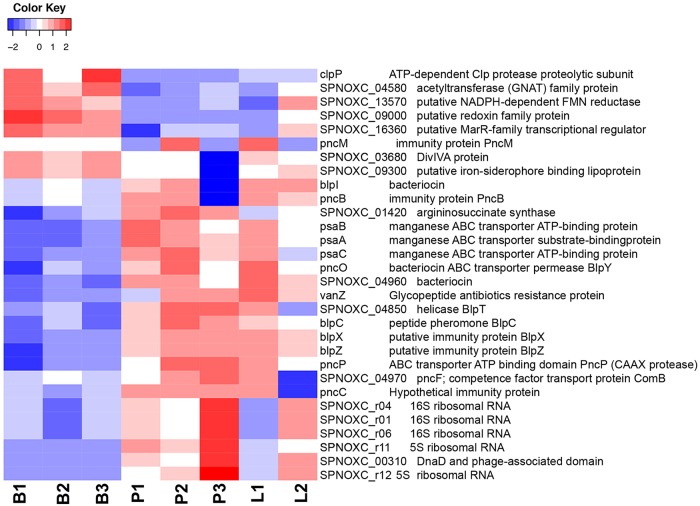
FIG 6.
Heat map showing levels of expression of the top 30 differentially expressed bacterial genes between broth (B), pleura (P), and the lung (L). Color coding shows the z score values of each sample as indicated in the scale, with red above the mean and blue beneath. GNAT, Gcn5-related N-acetyltransferase; FMN, flavin mononucleotide.

