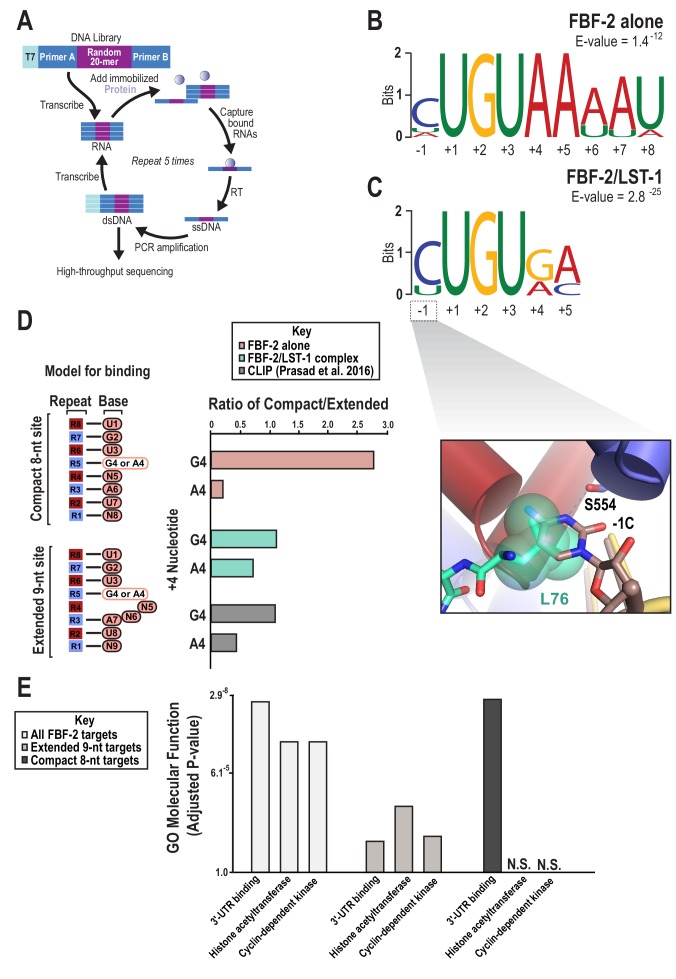
Figure 5. SEQRS analysis of FBF-2/LST-1 and FBF-2 reveals distinct specificities.
(A) Diagram of the SEQRS procedure. (B) Motif from SEQRS analysis of the FBF-2/LST-1 complex. (C) Motif from SEQRS analysis of FBF-2. Inset, superposition of the upstream C pocket in structures of the FBF-2/LST-1/RNA ternary and FBF-2/RNA binary complexes demonstrates that LST-1 L76 occupies the upstream C pocket in the structure of the ternary complex. (D) Comparative analysis of biases at base +4 in compact vs extended motifs. Sequences that conform to either the compact 8-nt or extended 9-nt sites were quantified in SEQRS data for FBF-2 alone (pink), the LST-1/FBF-2 complex (cyan), or CLIP data for FBF-2 (gray). (E) GO term analysis of FBF-2 mRNA targets. P-values were corrected using the Benjamini-Hochberg method (Kuleshov et al., 2016). Enrichment for compact sequences or extended binding elements was determined using the grep command on FBF-2 CLIP targets (Prasad et al., 2016). The abbreviation N.S. indicates that enrichment failed to achieve significance (adjusted p<0.05).


