. 2019 Jul 31;8:e46615. doi: 10.7554/eLife.46615

Figure 5. Computational validation of peptidisc interactome.

(A) Fraction of interacting pairs sharing a gene ontology (GO) term for the peptidisc (top) and CE interactomes (bottom). Both the full peptidisc interactome (4911 interactions, white) and the High Confidence subset are shown (black). ‘Random’ shows the expected number of shared terms from randomly rewired peptidisc and CE interactomes (1000 iterations, gray bars). (B) Fraction of interacting pairs with positively correlated Tolerome profiles (R > 0, Pearson correlation). (C) Fraction of interacting pairs sharing binding domains. (D) Number of overlapping interactions between peptidisc and CE interactomes compared to random. (E) True (‘data’) and random distributions for M3D co-expression correlation (Pearson) for peptidisc, High Confidence, and CE. Random distributions generated by randomly rewiring networks.

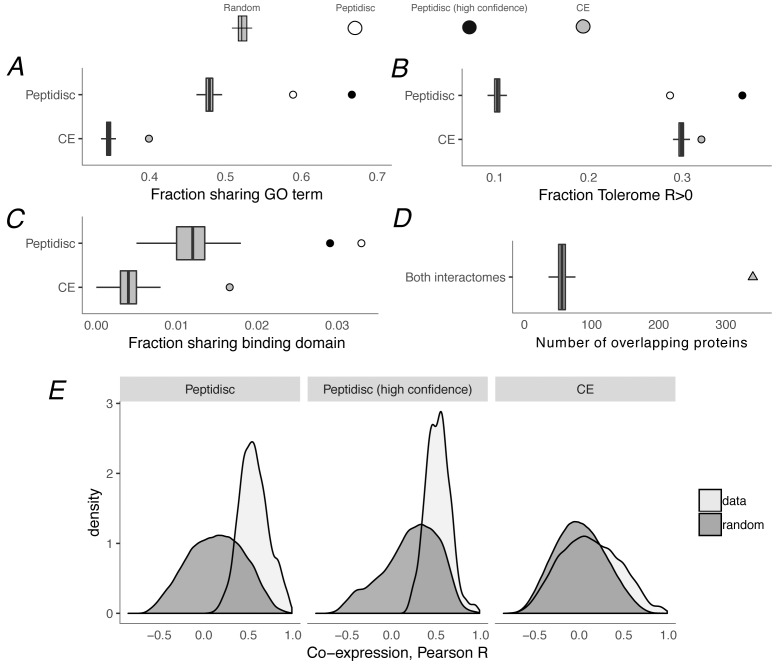
Figure 5.

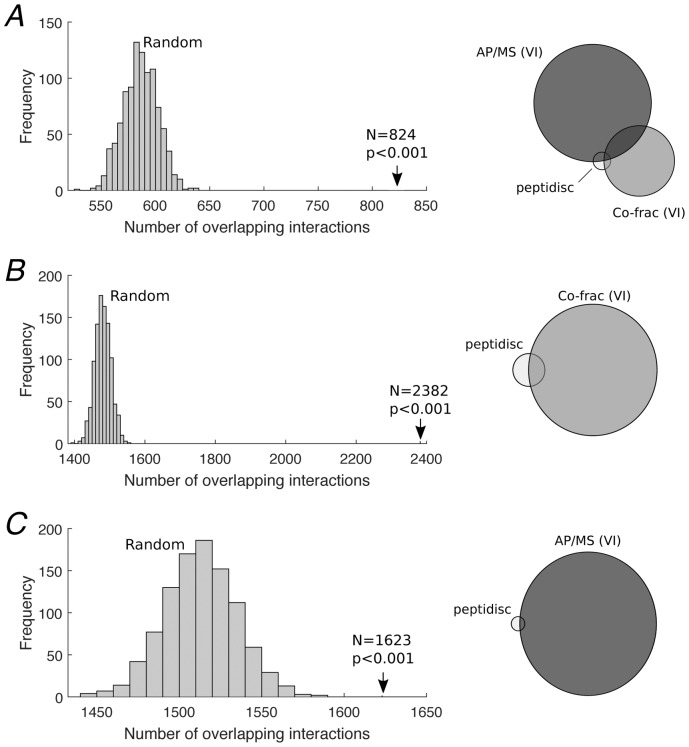
Figure 5—figure supplement 1. Defining the High Confidence subset of interactions.

Figure 5—figure supplement 1.

(A) 824 High Confidence interactions were defined as the subset of the peptidisc interactome that was also detected by both the AP/MS and co-fractionation validating interactomes (right). Significance of the overlap was assessed via permutation test, where 4911 random interactions were assigned between proteins found in the peptidisc interactome and overlapping interactions were counted between the random interactome and validating interactomes; this process was repeated 1000 times, generating a null/random distribution (left). Overlap was significant (p<0.001). (B) Overlap between peptidisc interactome and the co-fractionation VI (right) and permutation test (left). (C) Overlap between peptidisc and AP/MS VI (right) and permutation test (left). VI: validating interactome.