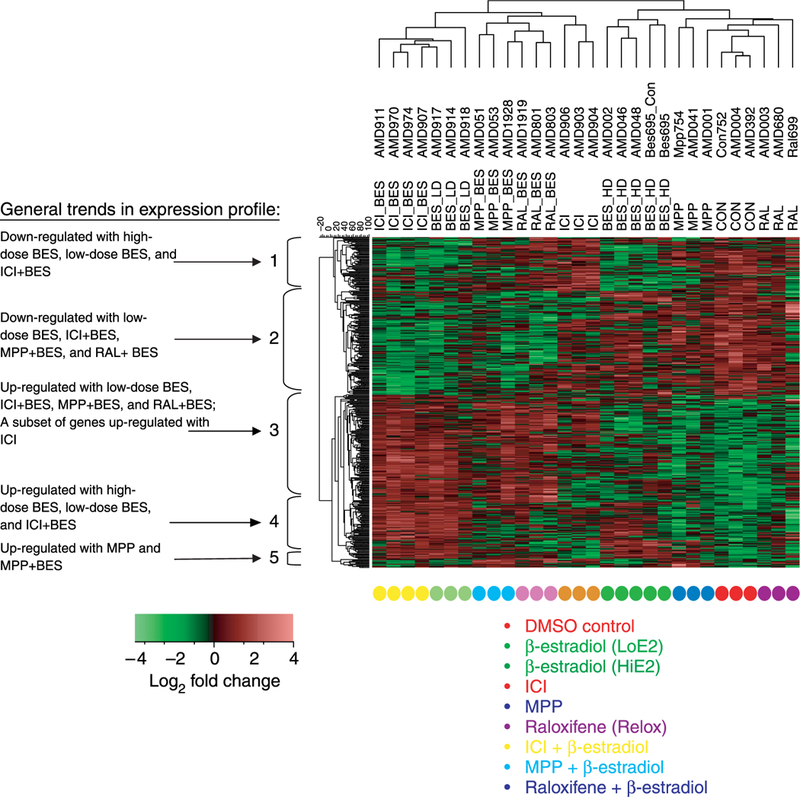
Figure 1.

Clustered heatmap of microarray analysis. Probes on the map represent genes regulated at least 1.5-fold changes versus DMSO vehicle control. Red, up-regulated; green, down-regulated; and black, intermediate expression (key in upper left corner); see Materials and methods for a complete description of the analytic methods used to generate this heatmap. Treatments are color coded and listed below the map. In general, the high-dose 17β-estradiol group clustered more closely with the MPP and raloxifene single treatments; whereas the low-dose 17β-estradiol group clustered with ICI 182 780 and combination treatments.
