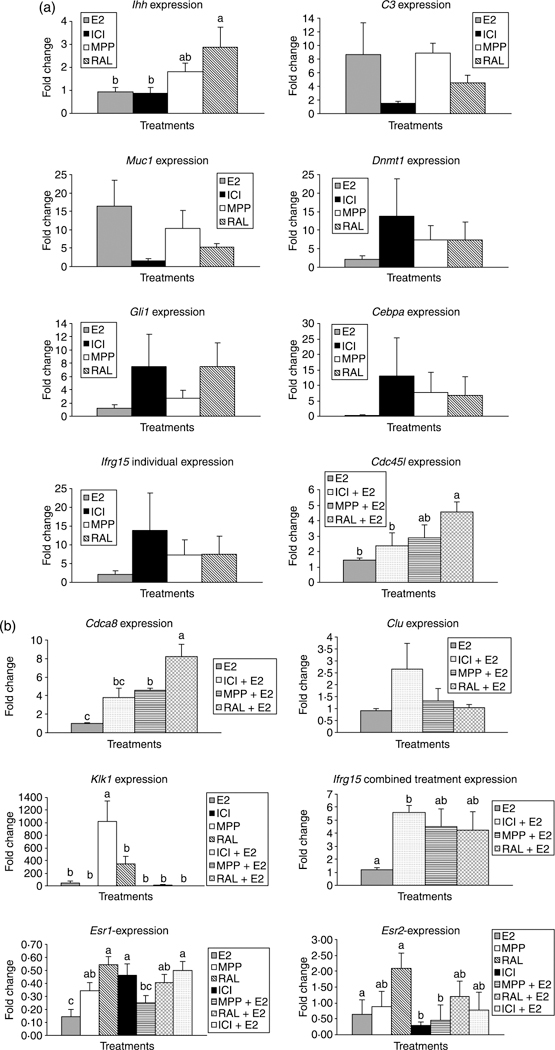
Figure 3.

Based on the microarray results, several genes were selected for analysis by quantitative real-time PCR (QRT-PCR). (a) Bars with varying letters indicate gene expression differences (P<0.05). The two genes that showed differences in expression for the various groups were Klk1 and Ihh with MPP and raloxifene respectively inducing the greatest changes in these genes. (b) Quantitative real-time PCR was also performed for selecting genes that differed in the microarray results between 17β-estradiol and the combination of 17β-estradiol with one of the SERM. The 18s gene served as the endogenous control and the DMSO treatment as the calibrator sample. Bars with varying superscripts indicate that the expression for this gene is significantly different for these treatment groups (P<0.001). Error bars, Standard errors of the mean (S.E.M). n=4 for each of the treatments and primers tested.
