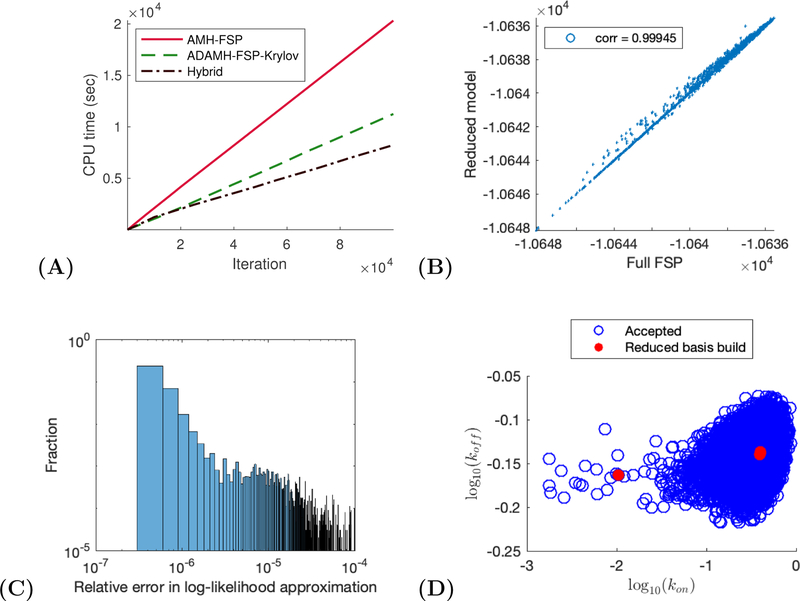
Figure 1:
Two-state gene expression example. (A) CPU time vs number of iterations for a sample run of the ADAMH-FSP-Krylov and the AMH-FSP. (B) Scatterplot of the unnomarlized log-posterior evaluated using the full FSP and the reduced model. Notice that the approximate and true values are almost identical with a correlation coefficient of approximately 0.99853. (C) Distribution of the relative error in the approximate log-likelihood evaluations at the parameters accepted by the ADAMH chain. (D) 2-D projections of parameter combinations accepted by the ADAMH scheme (blue) and parameter combinations used for reduced model construction (red).

