
Fig. 2.
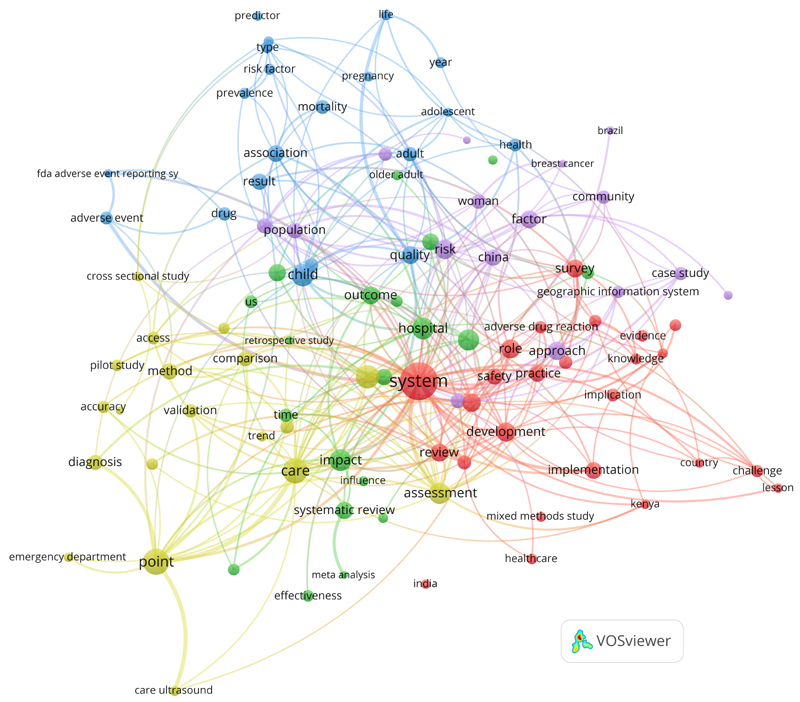
Clustered co-occurrence map of the most relevant terms (top-100) from the titles of the 2,264 papers in the 2019 CIS query result set. Node size corresponds to the frequency of the terms (binary count, once per paper). Edges indicate co-occurrence and distance of nodes corresponds to the association strength of the terms within the titles (only top 200 out of 455 edges are shown). Colors represent the five different clusters. The network was created with VOSviewer 9 .