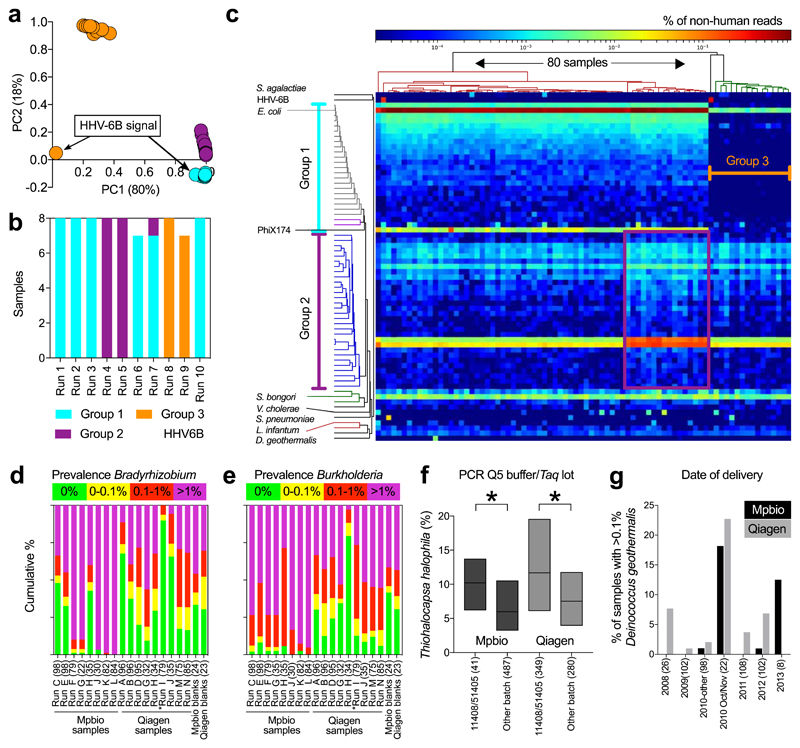
Fig. 1. Batch effect detection in metagenomic and 16S rRNA amplicon sequencing data, Cohort 1 samples.
a-c) Summary of metagenomics data. a) PCA of summarized genus level Kraken output. b) MiSeq sequencing runs (n=8 per run). c) Heatmap of all non-human read abundance (see Extended Data Figure 4). d,e) Read abundance by run and DNA isolation method (Mpbio or Qiagen) in chronological order, (d) Bradyrhizobium, and (e) Burkholderia. Scatterplots are shown in Extended Data Fig. 6. f) Associations between Thiohalocapsa halophila and Q5 Buffer or Taq polymerase. Interquartile range is shown. * P < 0.001. g) D. geothermalis detection (>0.1% reads) by year of delivery. Number of samples in each group (n).

